1236
Inventory Analysis Report
Inventory Analysis Report
More Report pages
Report Author: Sweety Antoni David
1236
Share template with others
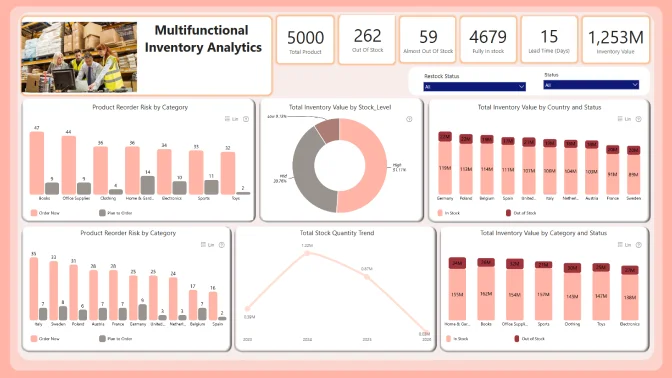
Report submitted for the FP20 Analytics ZoomCharts Challenge, April 2025. The report was built using the Inventory Management Dataset and includes ZoomCharts custom Drill Down PRO visuals for Power BI.
Author's description:
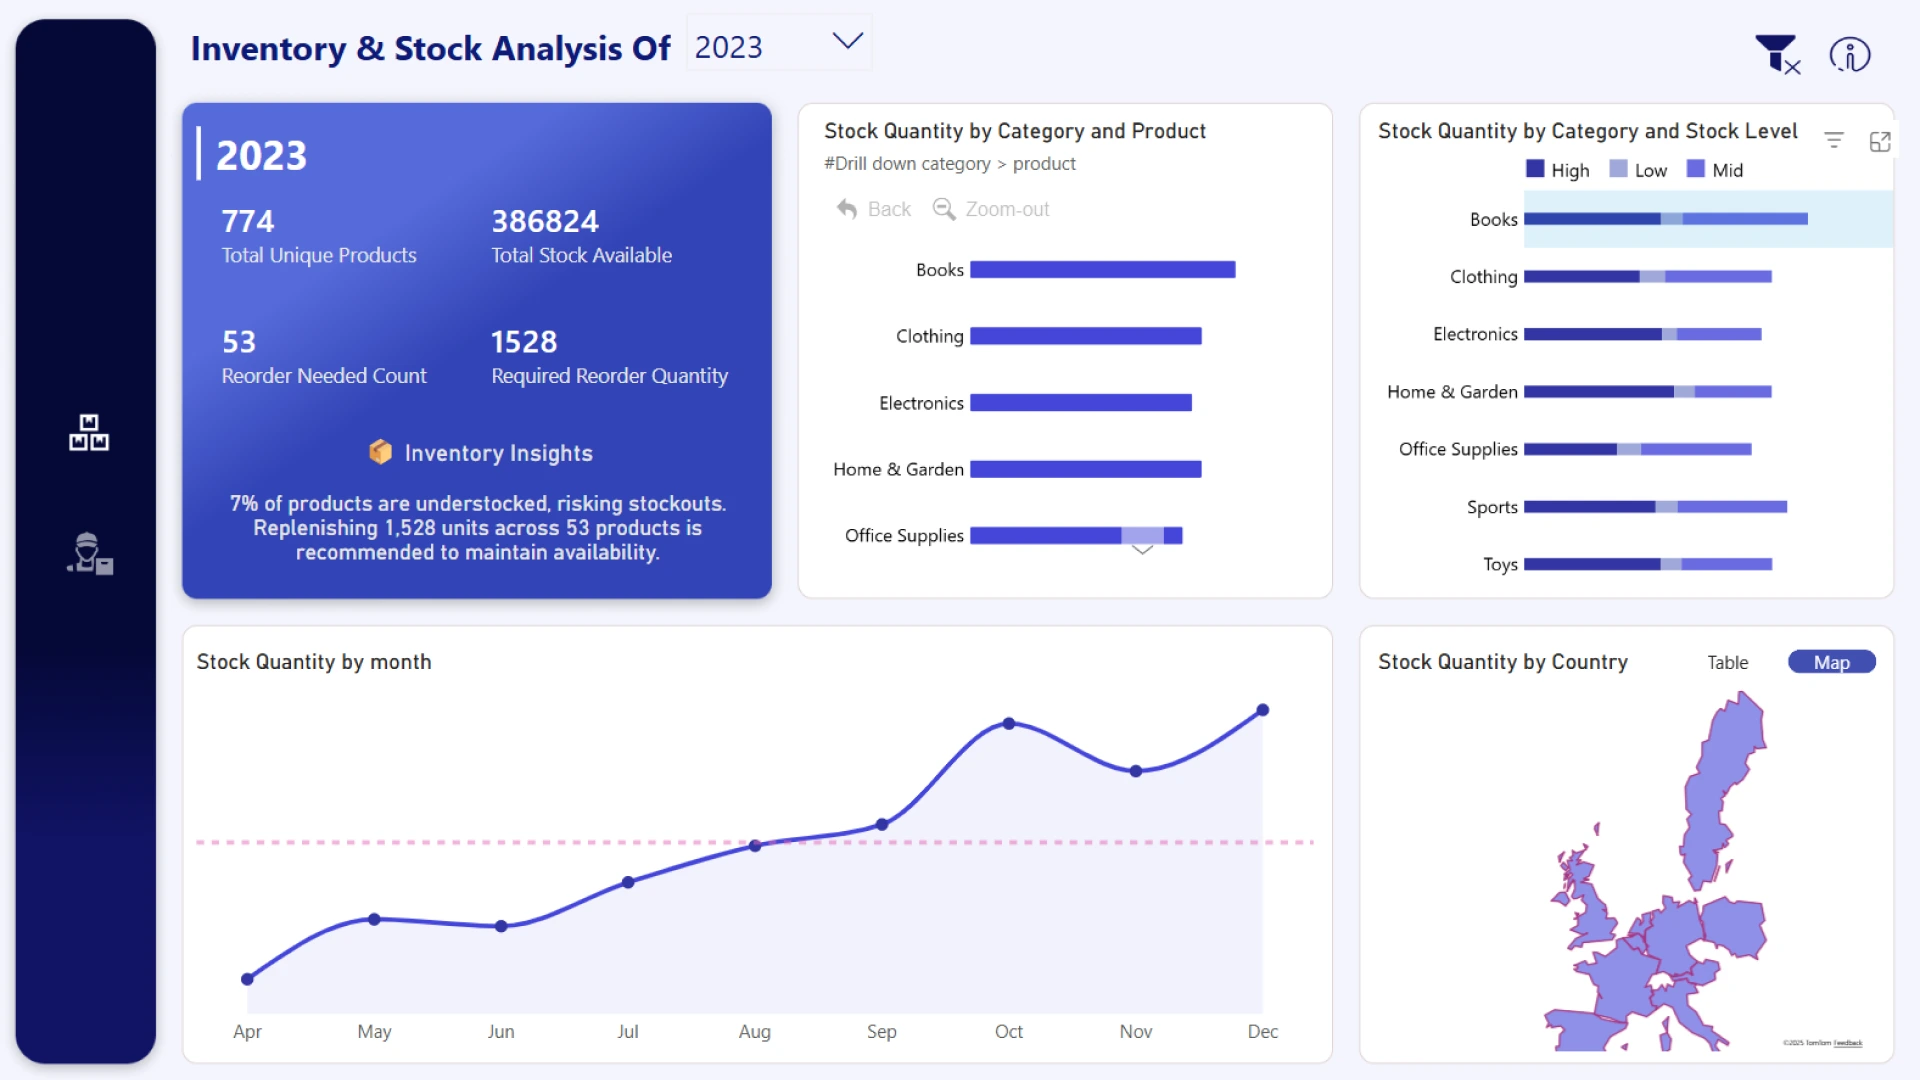
🟦 Page 1: Inventory Overview & Stock Analysis
This page provides a clear overview of stock availability and highlights potential inventory risks. It identifies which product categories carry the most stock and flags items that have dropped below their reorder point. The report also calculates the total minimum order quantity needed to replenish these critical items, helping ensure timely restocking.
In addition, it breaks down stock levels by category and location, offering insight into how inventory is distributed by product type and region. These insights support better supply planning and help reduce the risk of stockouts.
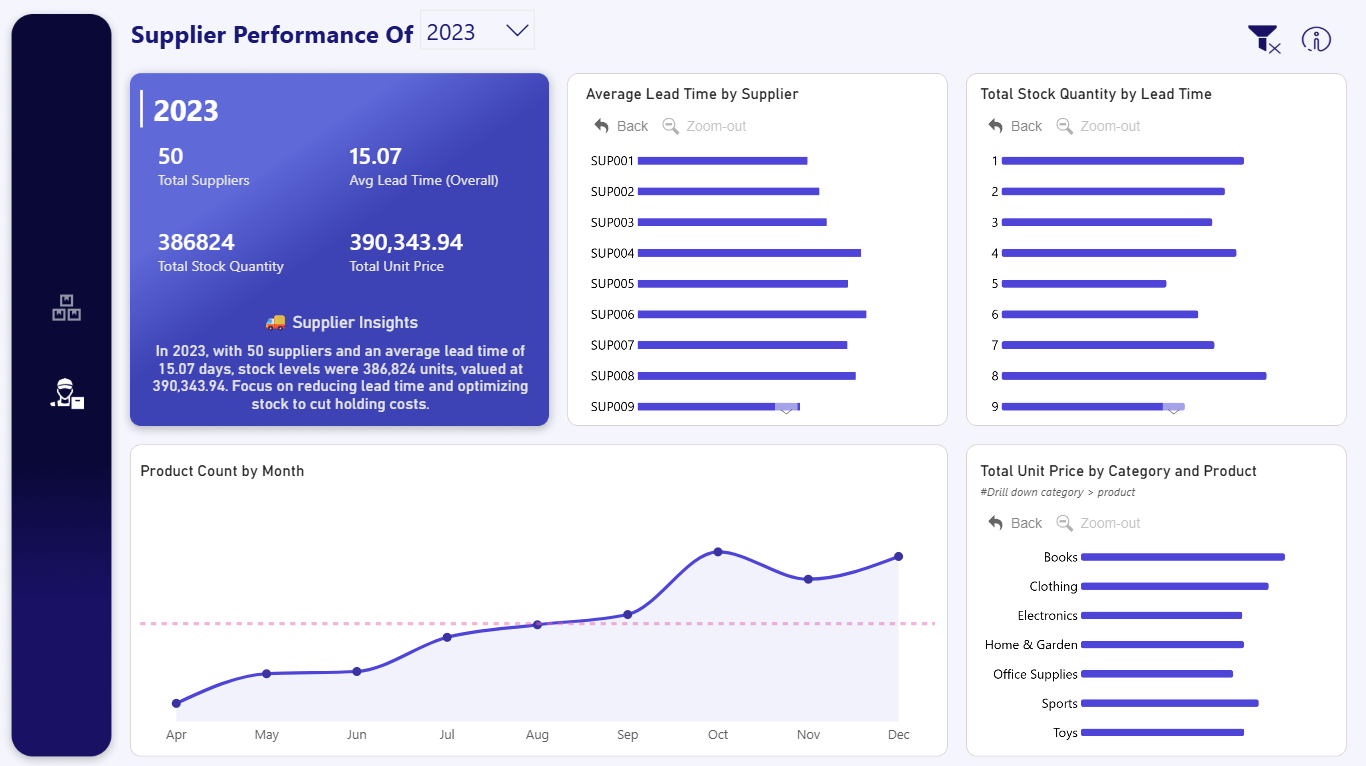
🟧 Page 2: Supplier Performance
This page focuses on analyzing supplier efficiency and restocking patterns over time. It shows the average lead time for each supplier, enabling better evaluation of supplier performance. It also tracks how long products have been out of stock since their last restock, which aids in stock management.
Monthly restocking trends are visualized to help identify seasonal patterns. By comparing lead times with current stock levels, the report flags high-risk products—those with both long lead times and low stock—enabling more informed procurement decisions and better risk management.
ZoomCharts visuals used

4U Report Challenges
Participate in data challenges, build and submit reports to get free template downloads.
Join CommunityMobile view allows you to interact with the report. To Download the template please switch to desktop view.
How to use a PBIX template
Preview the interactive report, download the PBIX file, open it in Power BI Desktop, and replace the same data connection with your own dataset.
Preview and download
Explore the report online and download the PBIX template file.
Open in Power BI Desktop
Open the downloaded PBIX file in Power BI Desktop.
Connect your data
Replace the sample data source with your own dataset.
Refresh and adjust
Refresh the model and update fields or visual were needed.
Save and share
Save your report and publish it for your audience.


