851
Holiday Retail Performance – Power BI
Holiday Retail Performance – Power BI
More Report pages
Report Author: Gayatri Devi Kajuluri
851
Share template with others
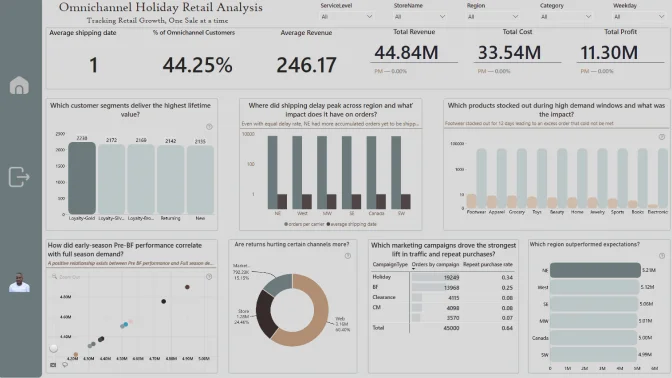
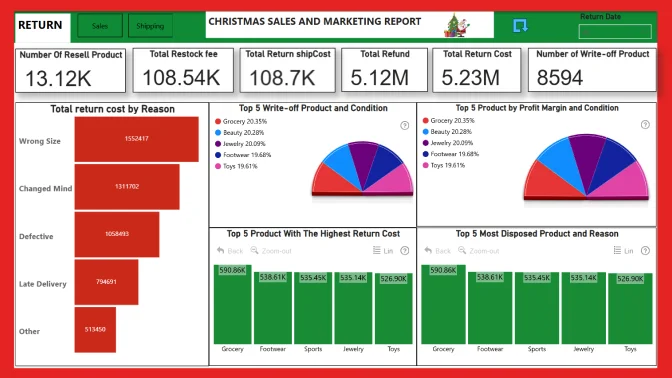
This Power BI report is built using the Omnichannel Holiday Retail Sales dataset and features ZoomCharts Drill Down PRO custom visuals for Power BI. It was submitted to the FP20 Analytics ZoomCharts Data Challenge #33 (December 2025 – January 2026).
Author's Description:
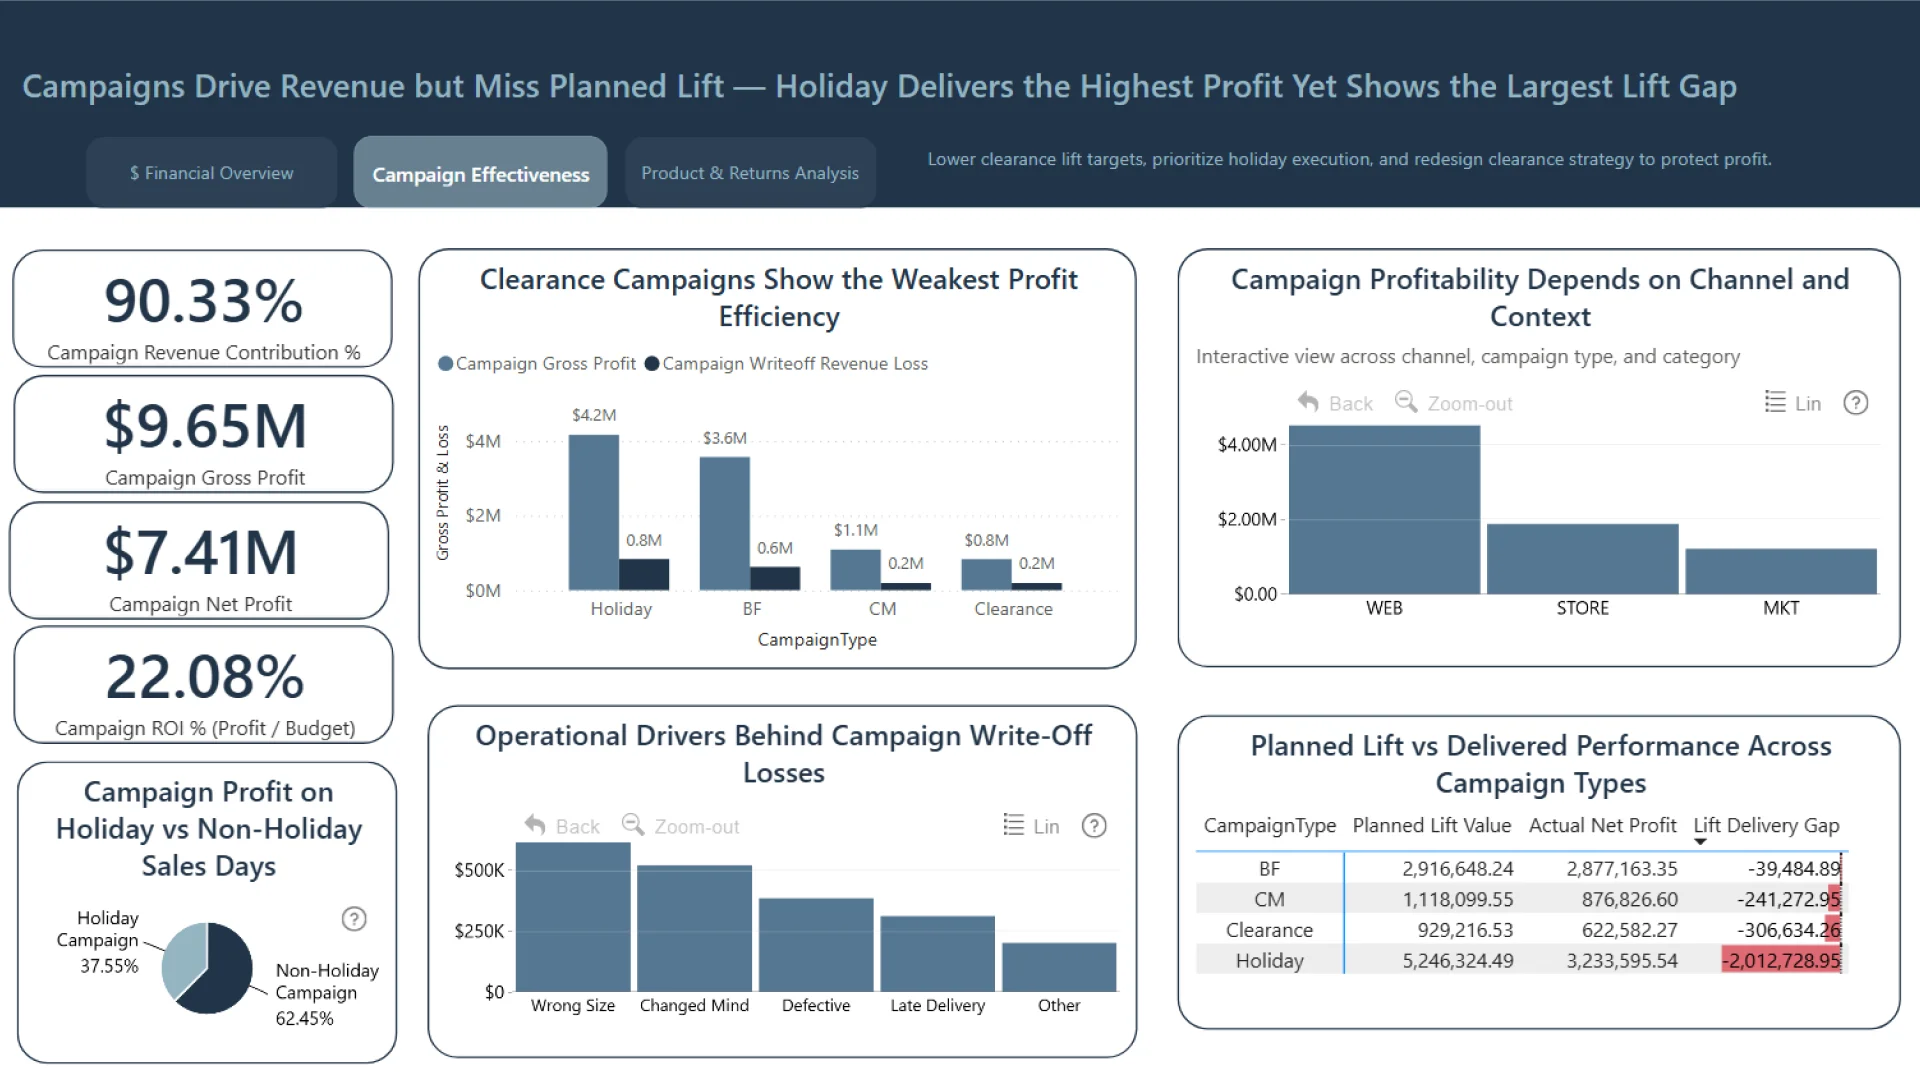
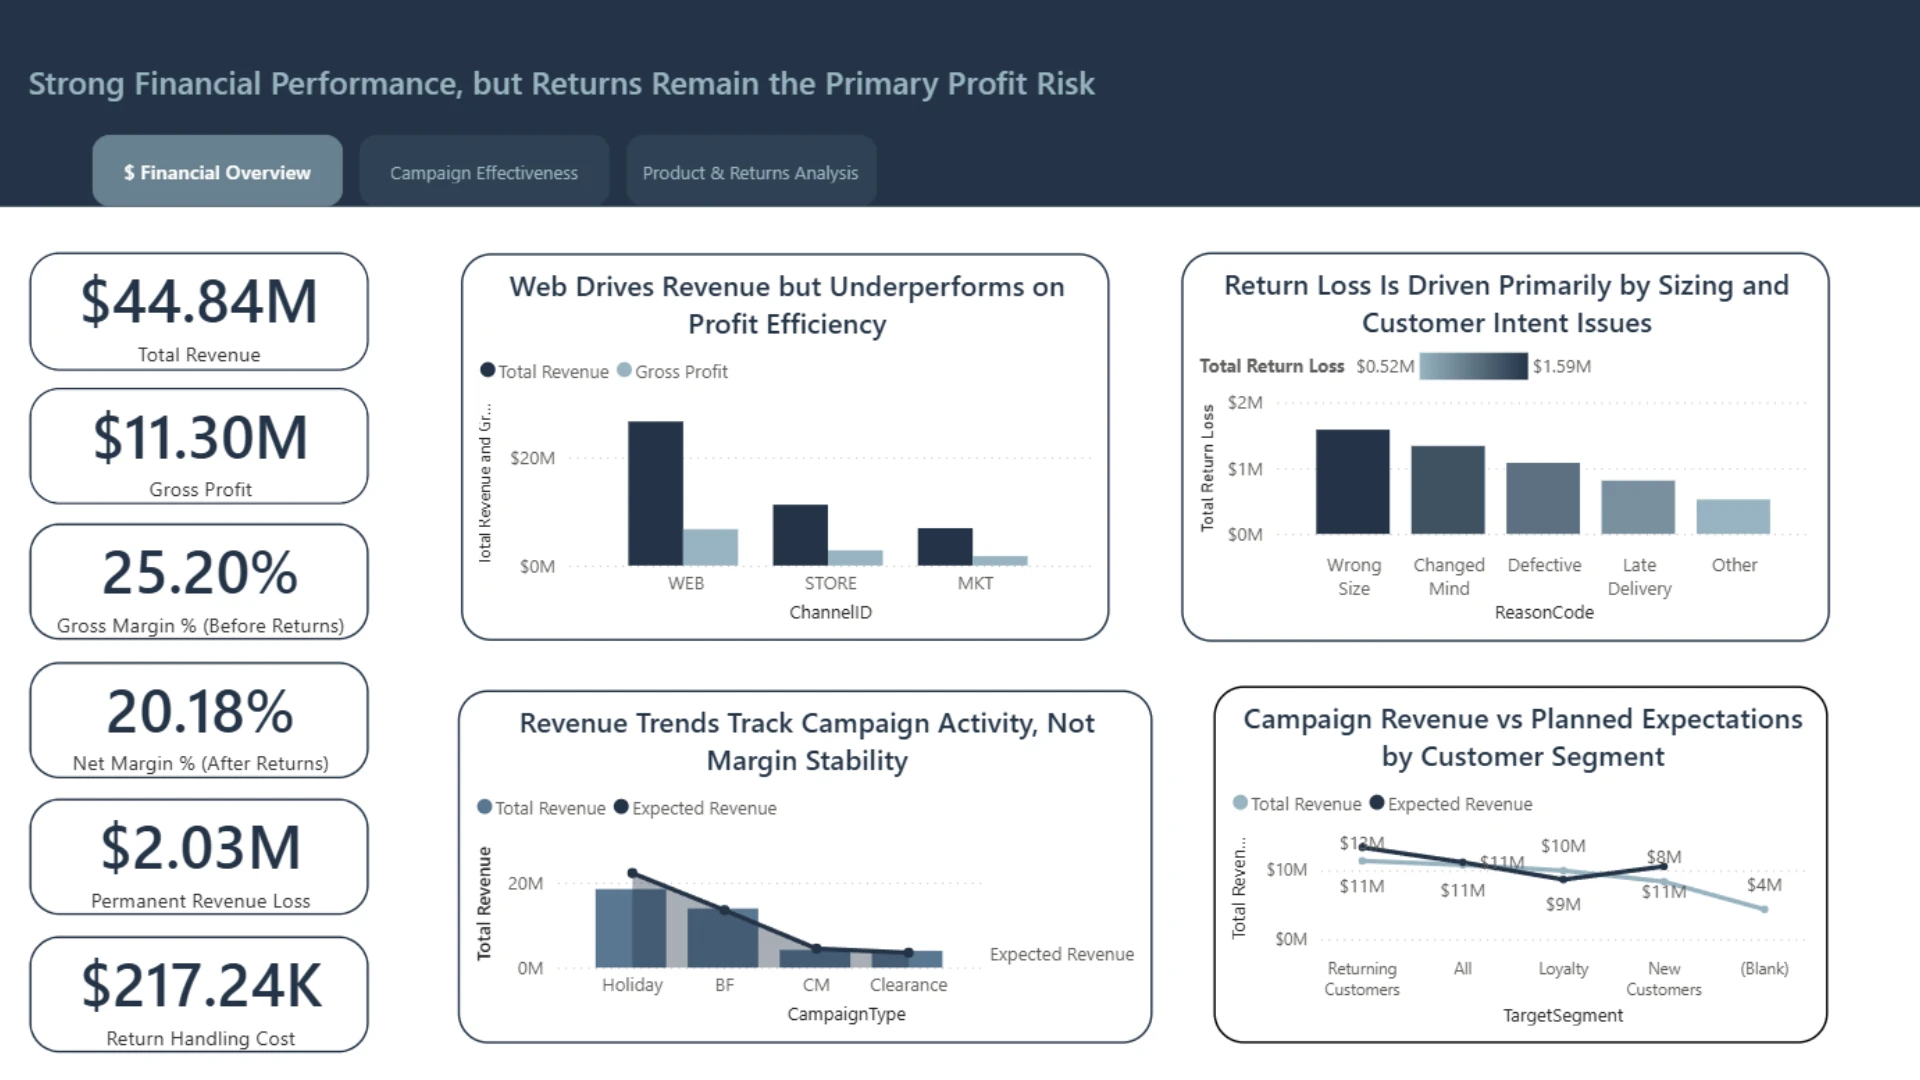
This dashboard provides a strategic analysis of a $44.84M retail operation, tracking the transition from Gross Revenue to Net Profitability and identifying key profit leakages where a 25.20% Gross Margin declines to a 20.18% Net Margin due to returns and operational handling costs. Returns drive a $2.03M permanent revenue loss and $217.24K in handling costs, primarily caused by customer sizing issues, while write-offs total $2.12M with an 11.95% return rate, placing Footwear in a priority risk zone.
Holiday campaigns generate the highest profit but reveal a -$20.1M lift delivery gap, highlighting demand planning opportunities, and the Web channel, despite leading in revenue, underperforms in profit efficiency compared to physical stores. The model is supported by a robust star schema, optimized DAX architecture, and interactive drill-down visuals that enable analysis from high-level financial trends to vendor-level write-offs.
4U Report Challenges
Participate in data challenges, build and submit reports to get free template downloads.
Join CommunityMobile view allows you to interact with the report. To Download the template please switch to desktop view.
Was this helpful? Thank you for your feedback!
Sorry about that.
How can we improve it?