This Power BI report is built using the Omnichannel Holiday Retail Sales dataset and features ZoomCharts Drill Down PRO custom visuals for Power BI. It was submitted to the FP20 Analytics ZoomCharts Data Challenge #33 (December 2025 – January 2026).
Author's Description:
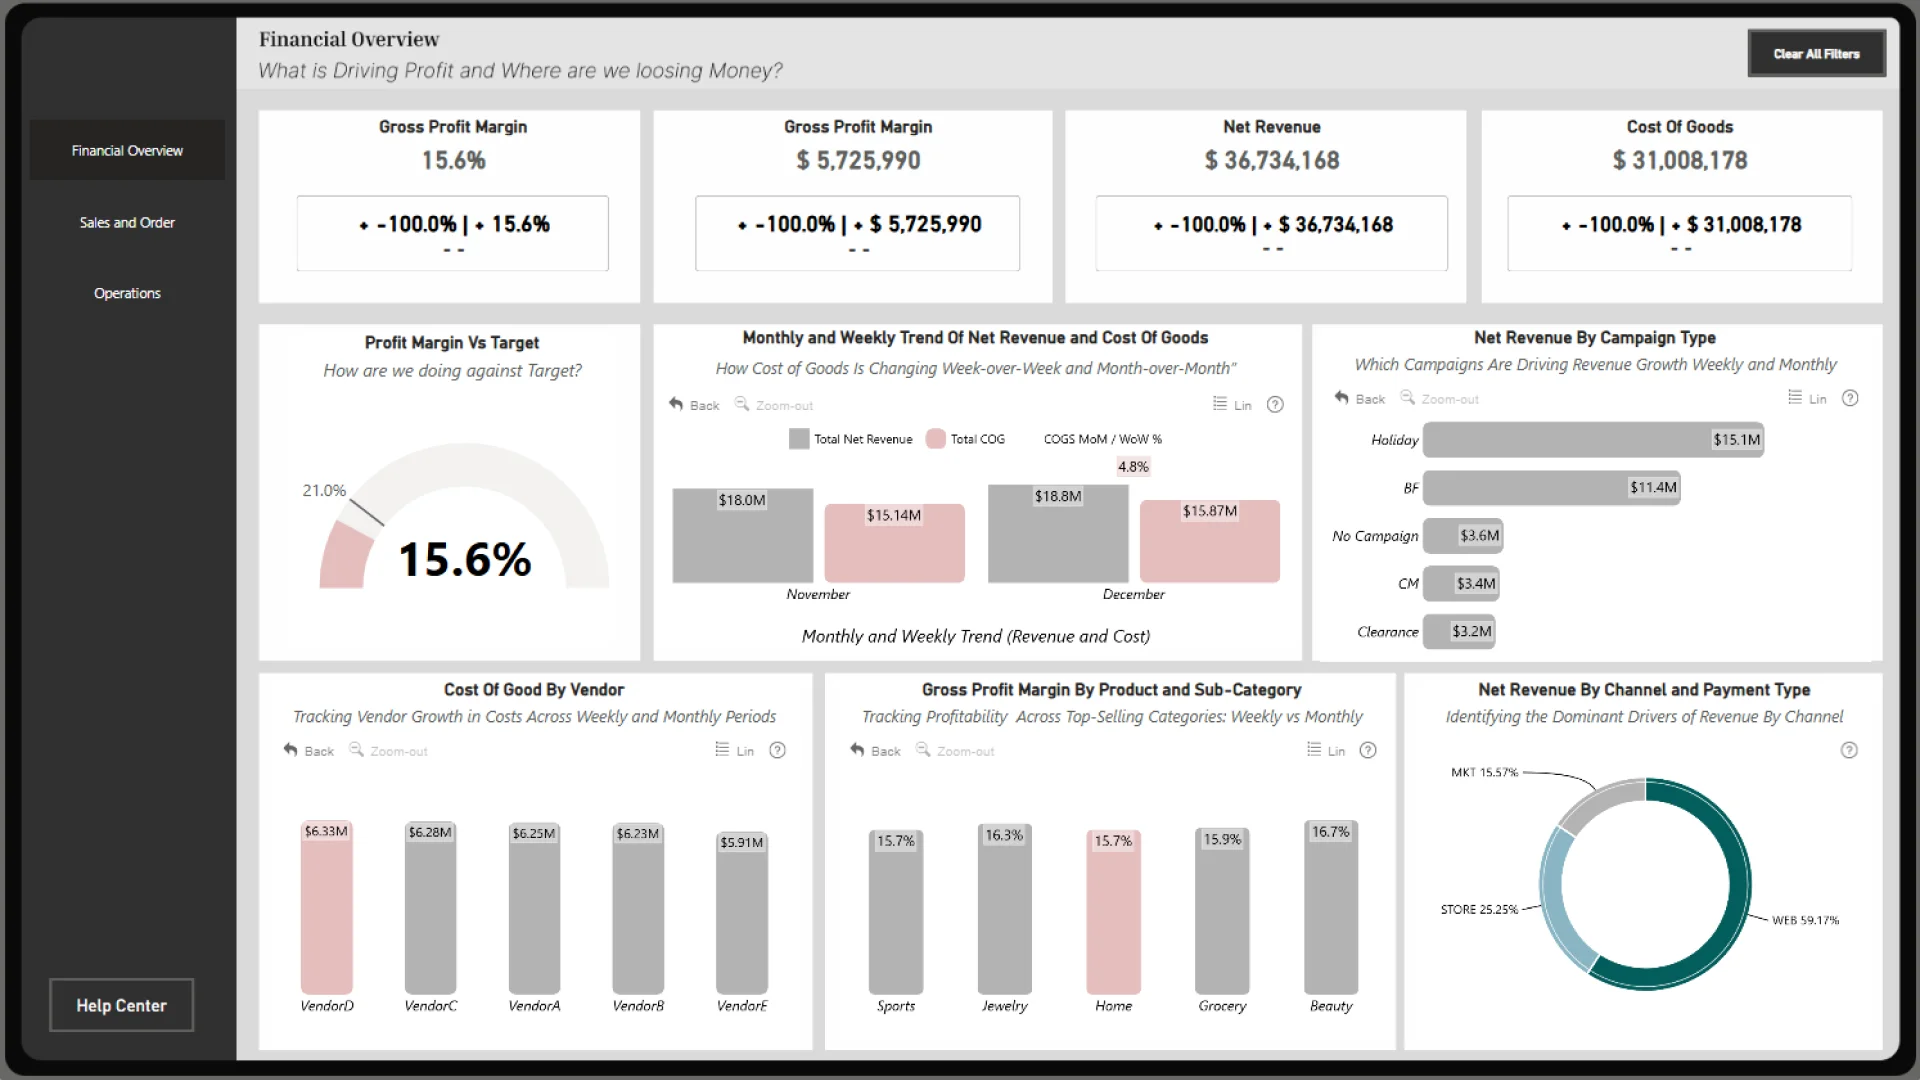
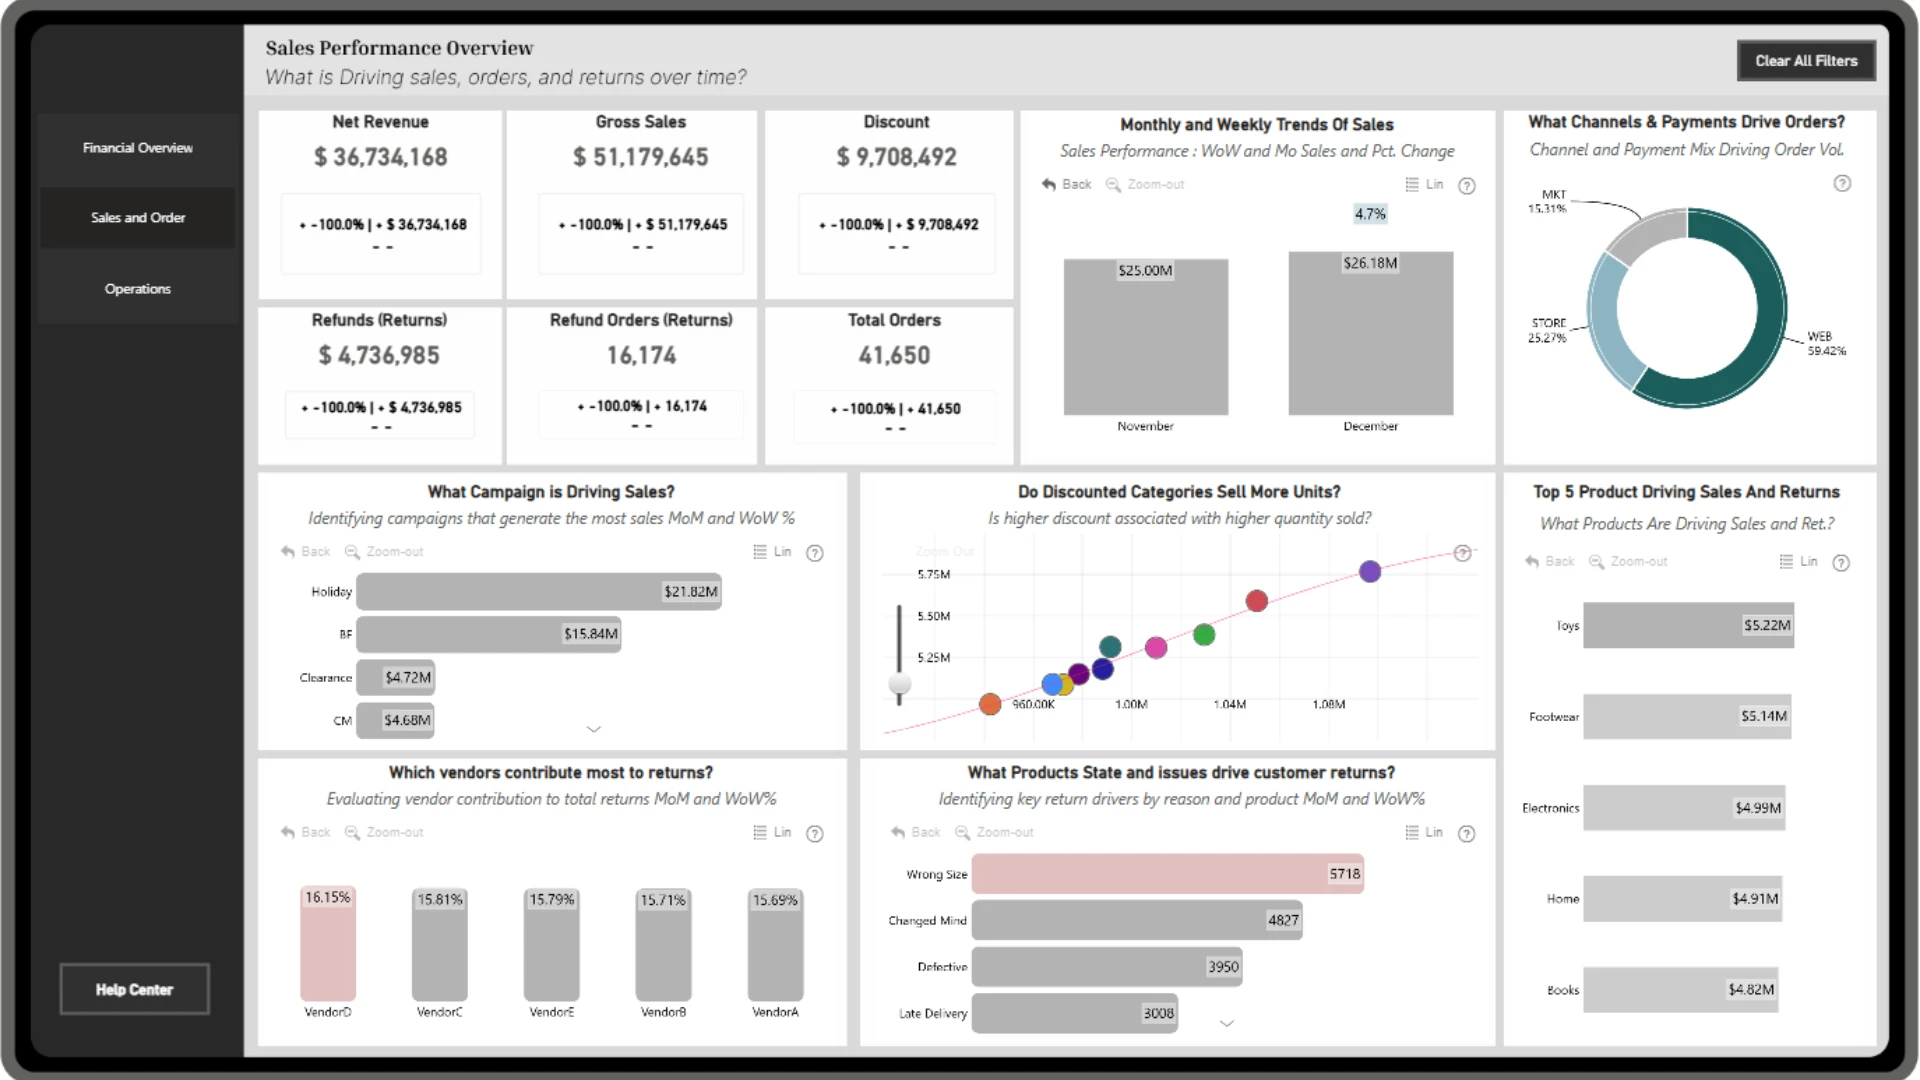
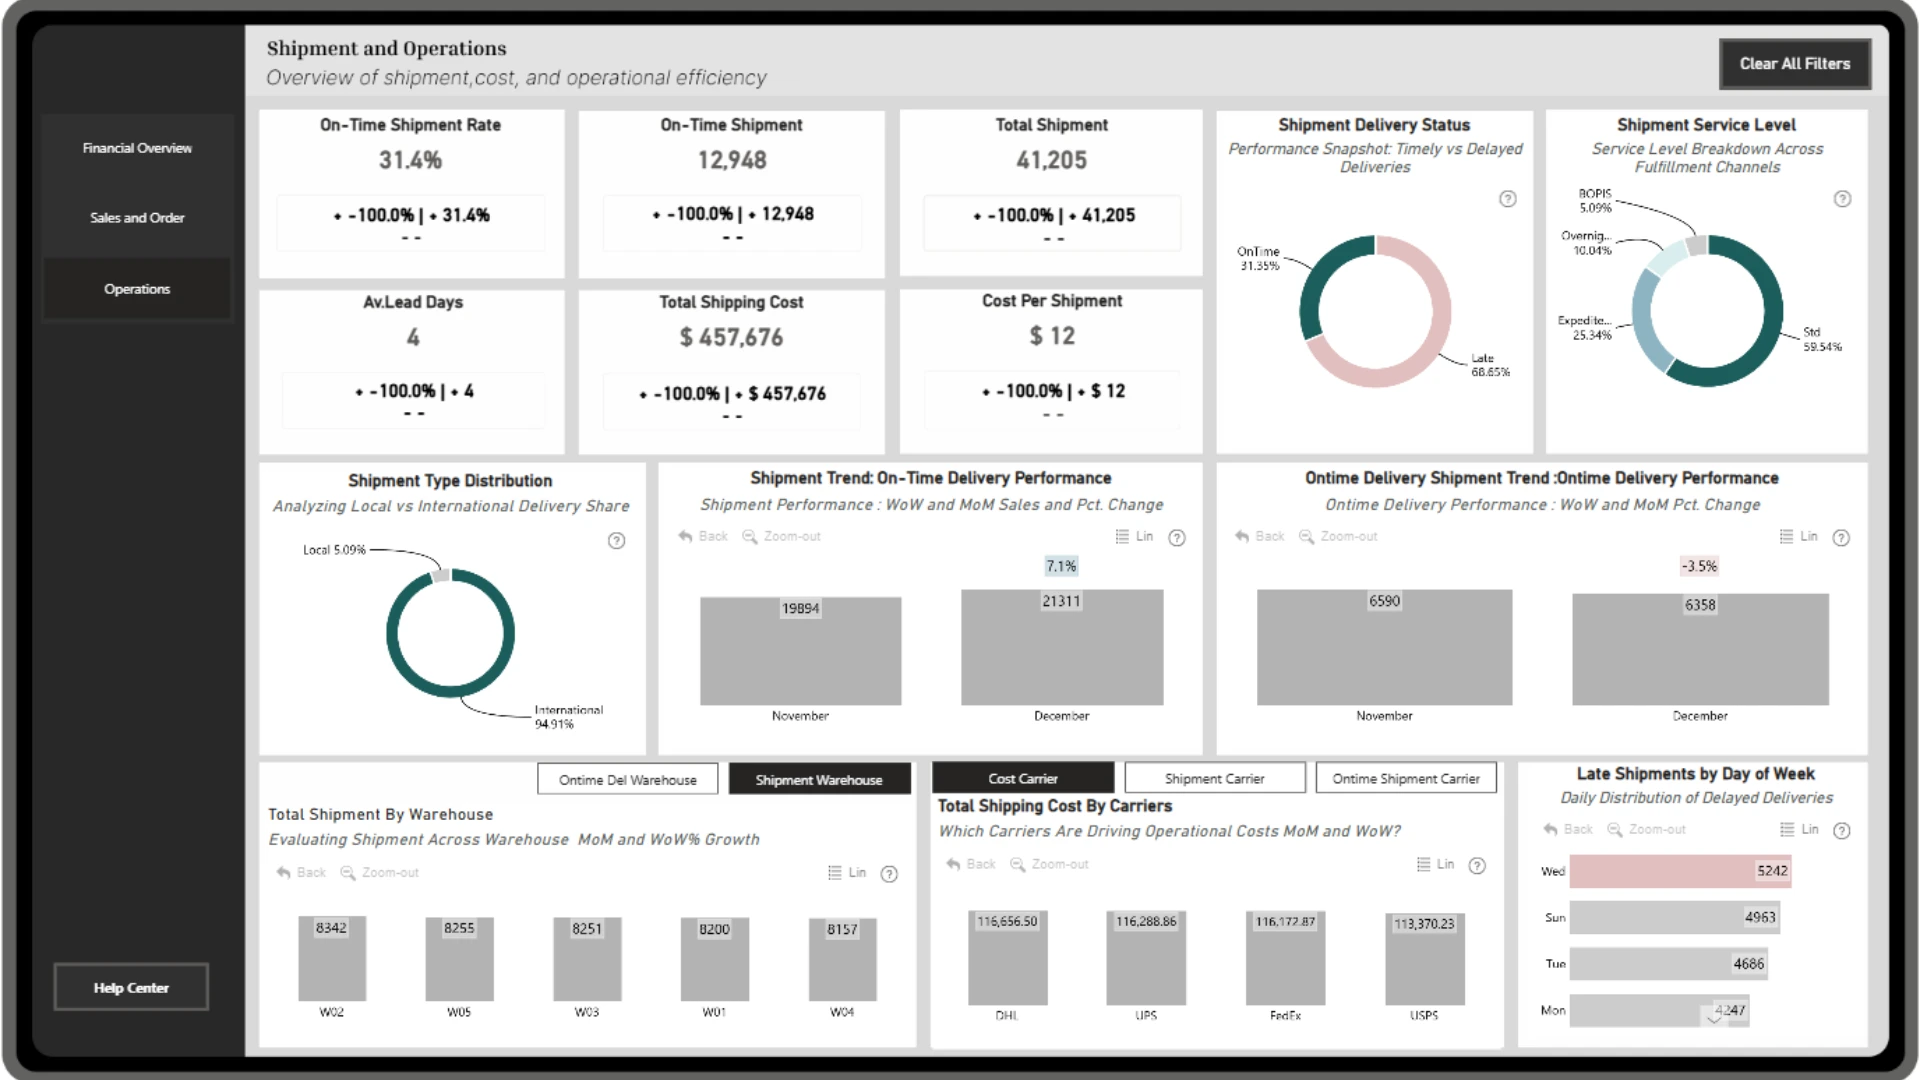
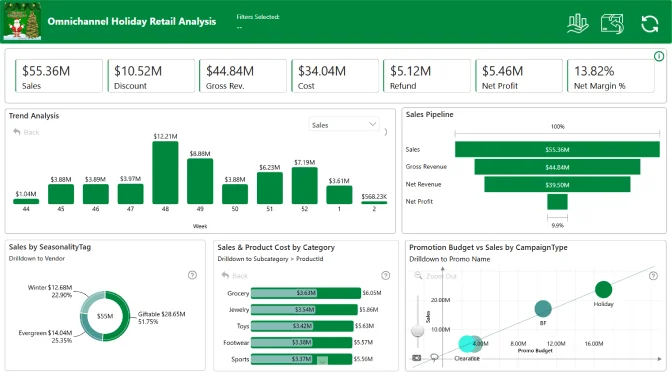
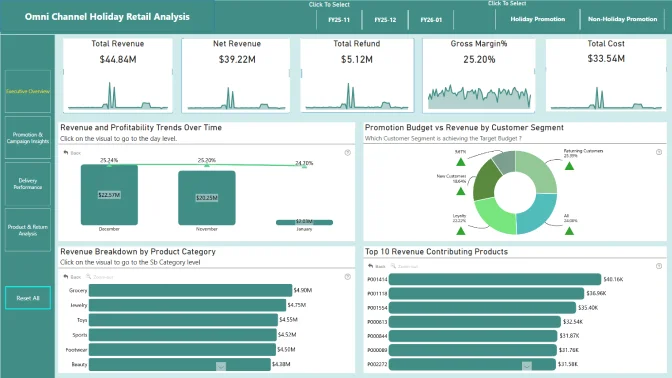
Gross Profit Margin declined 0.2% MoM as COGS grew faster than Net Revenue, with cost pressure concentrated in Week 50 and Vendor B, despite strong campaign-led demand. Net Revenue increased 4.5% MoM but rising discounts and refunds diluted gains, indicating volume-led growth with quality constraints. Shipment volume growth reduced on-time performance, increased costs, and intensified operational risk during peak weeks, reinforcing the need for tighter cost, return, and fulfillment controls.
818
Holiday Retail Analytics in Power BI
Holiday Retail Analytics in Power BI
More Report pages
Report Author: Eniola Adekoya
818
Share template with others
ZoomCharts visuals used
4U Report Challenges
Participate in data challenges, build and submit reports to get free template downloads.
Join CommunityMobile view allows you to interact with the report. To Download the template please switch to desktop view.
Was this helpful? Thank you for your feedback!
Sorry about that.
How can we improve it?