27
Healthcare Performance Monitoring Dashboard
Healthcare Performance Monitoring Dashboard
More Report pages
Report Author: Kenneth Amobi
27
Share template with others
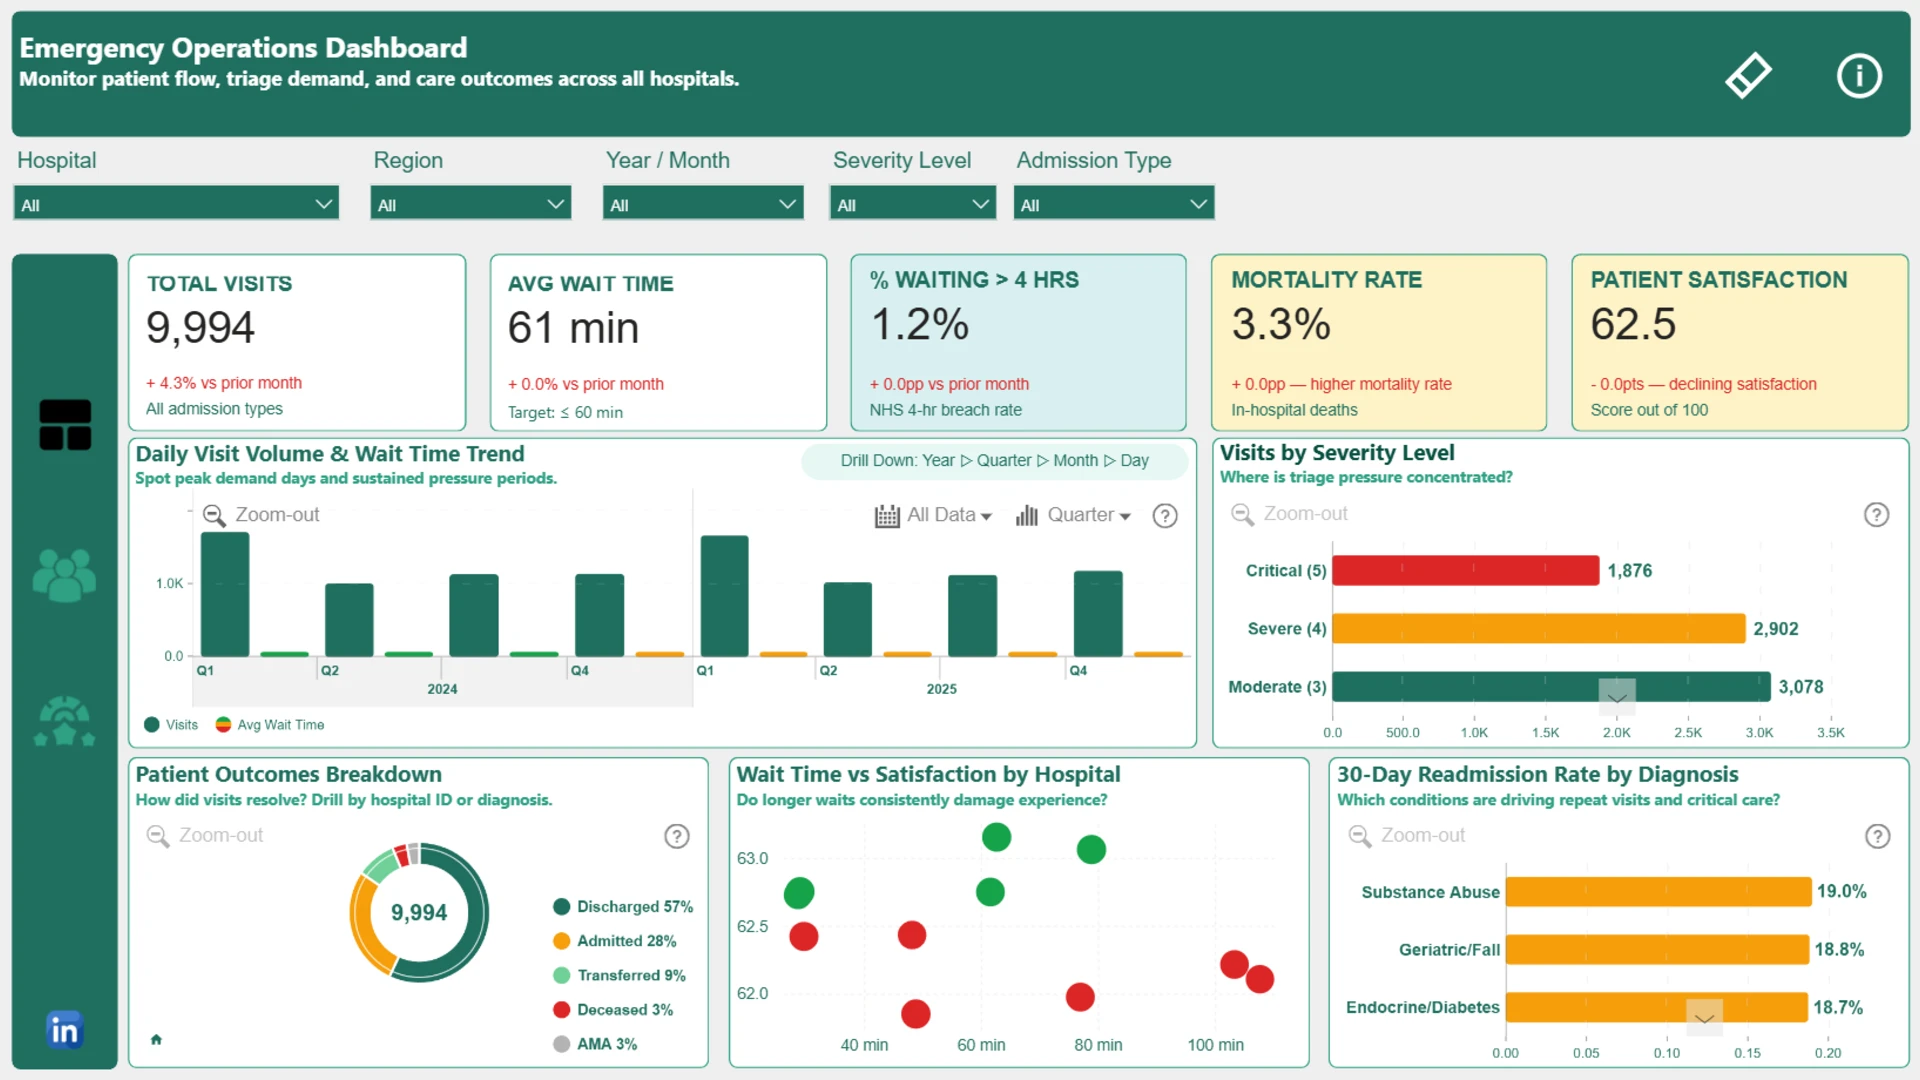
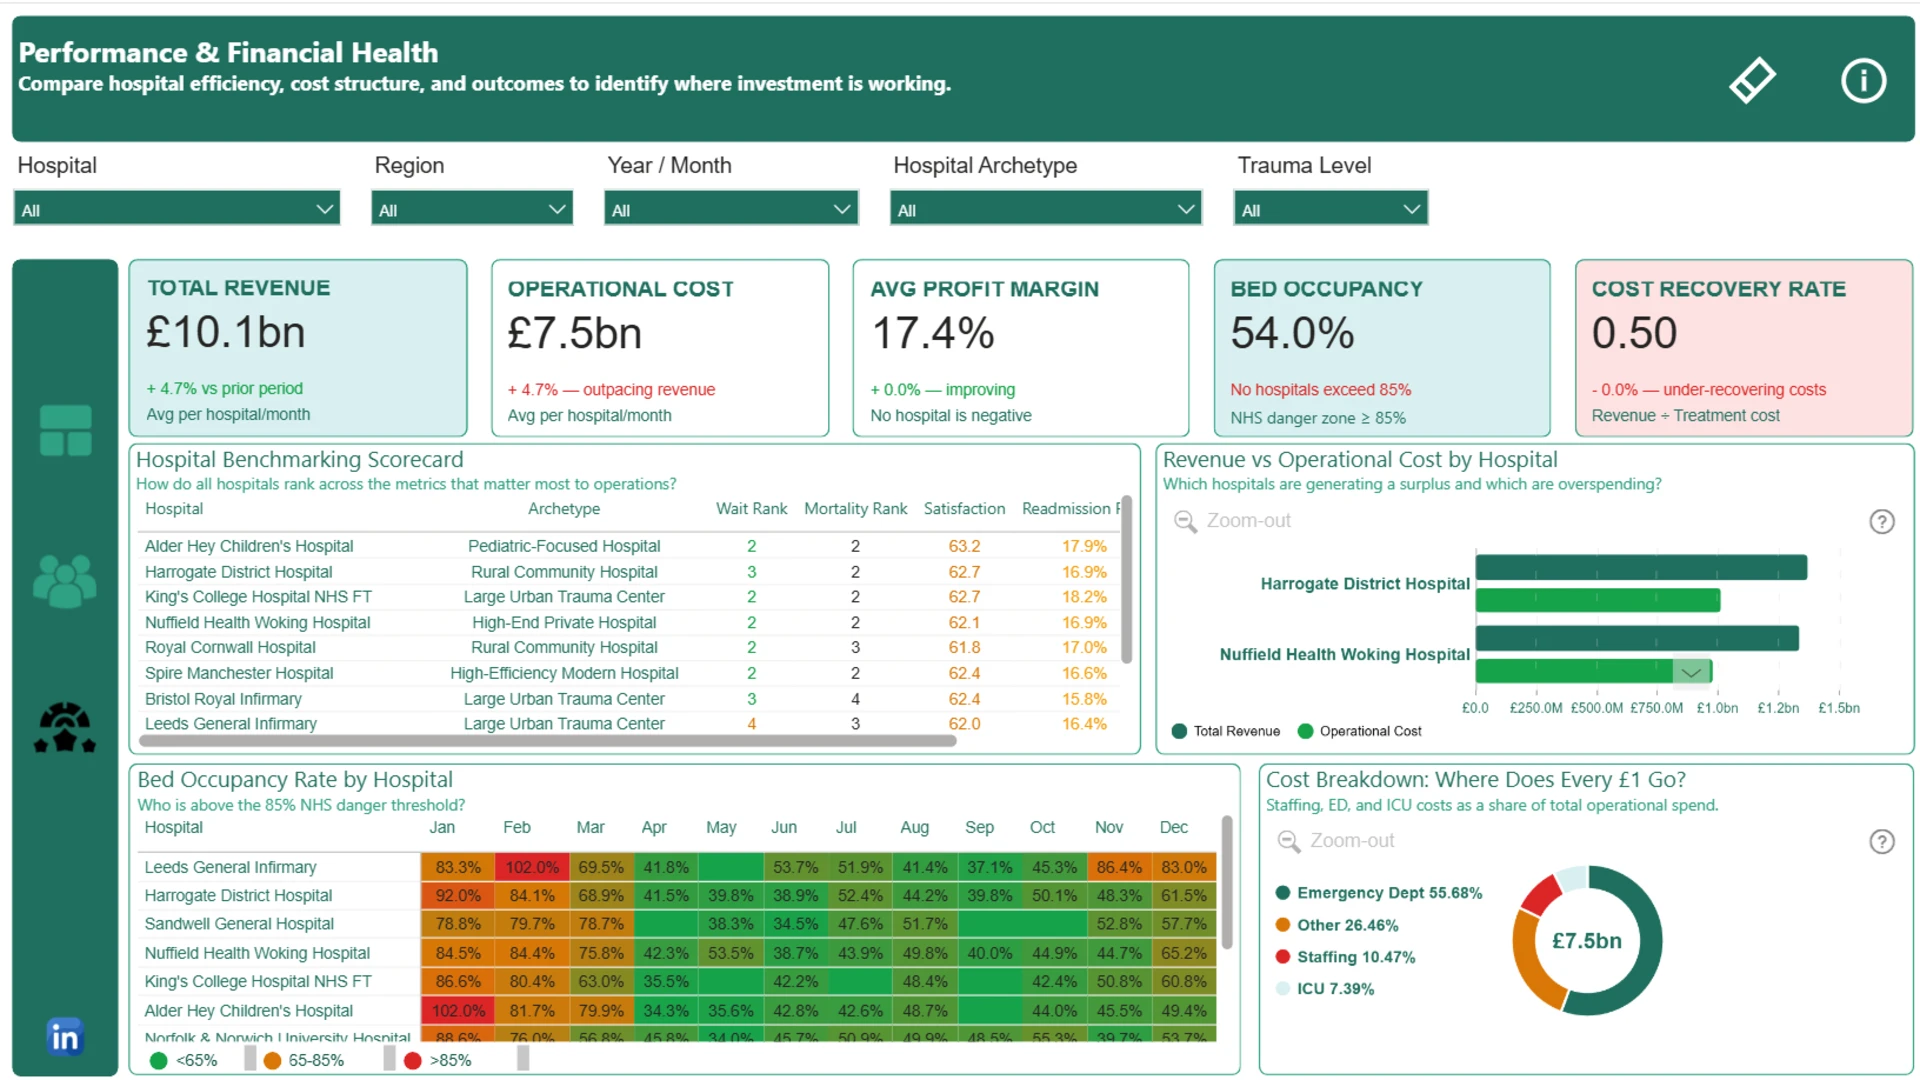
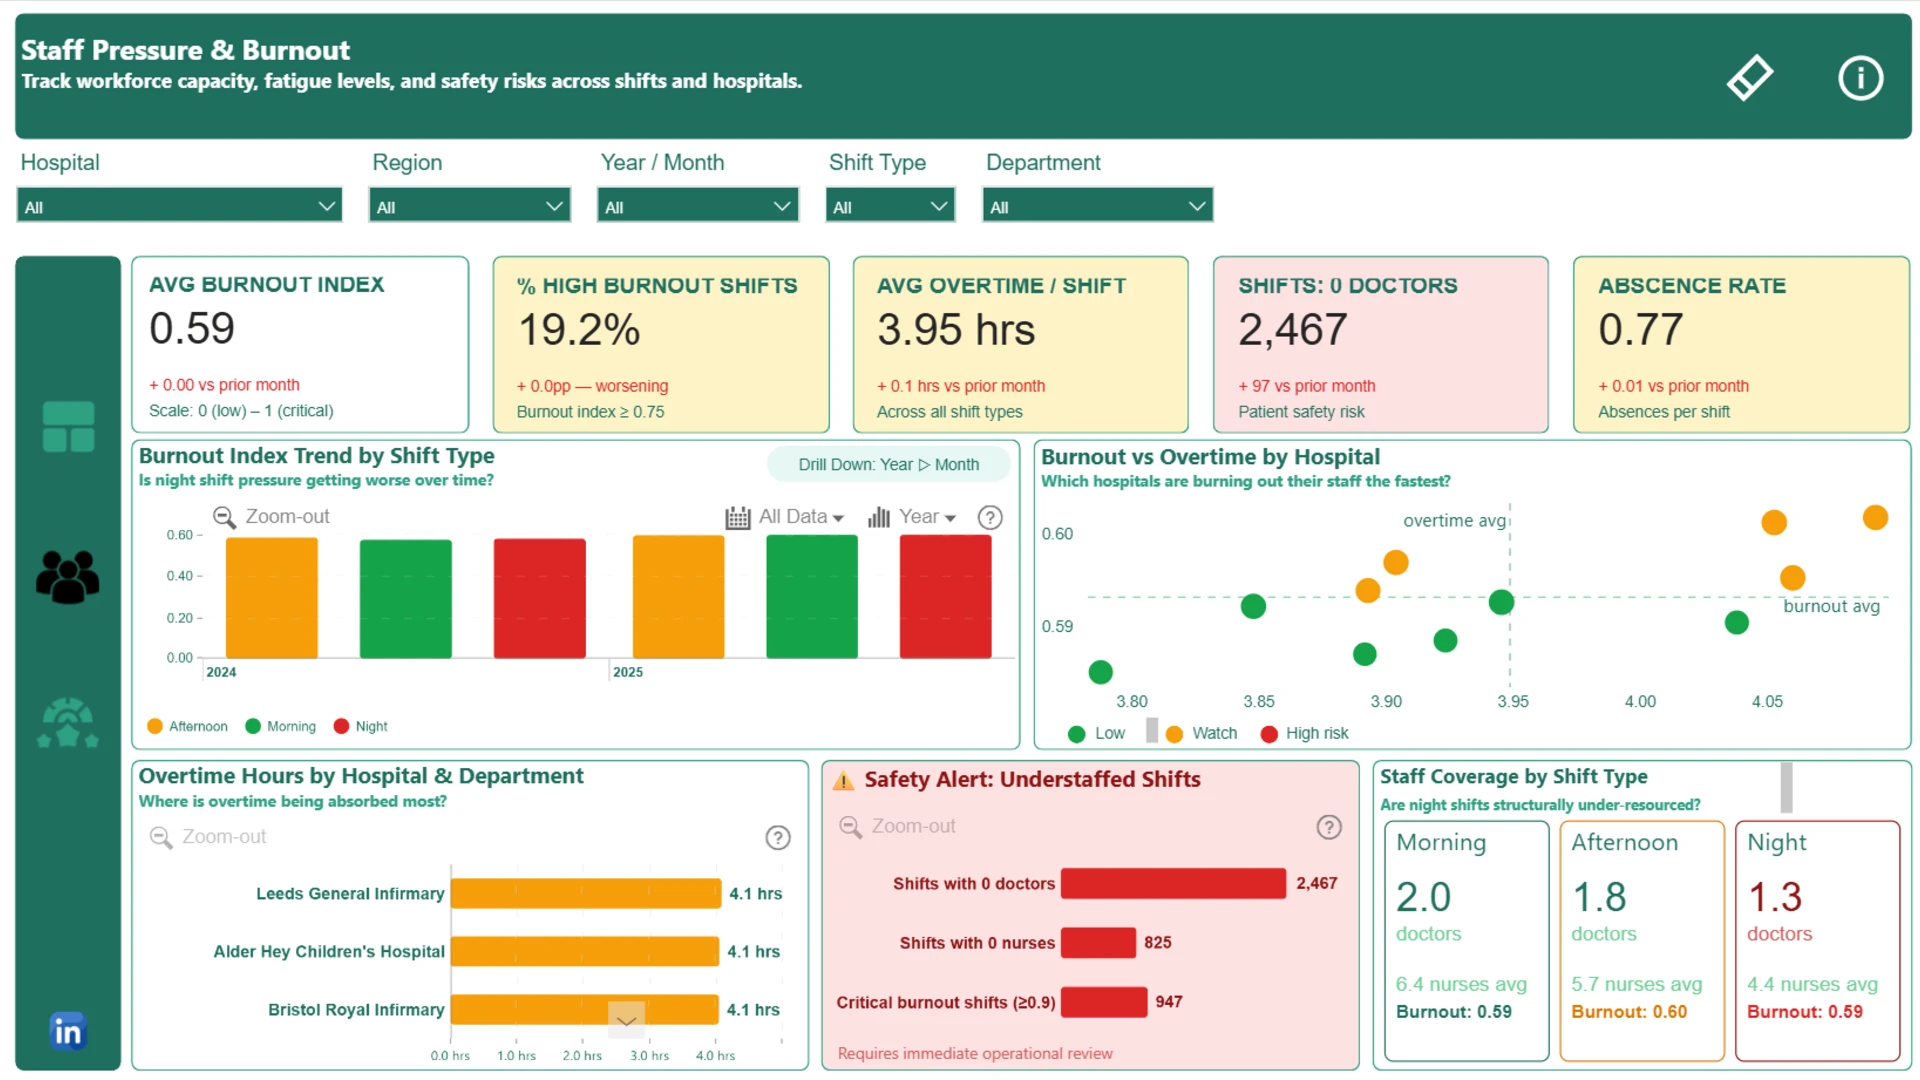
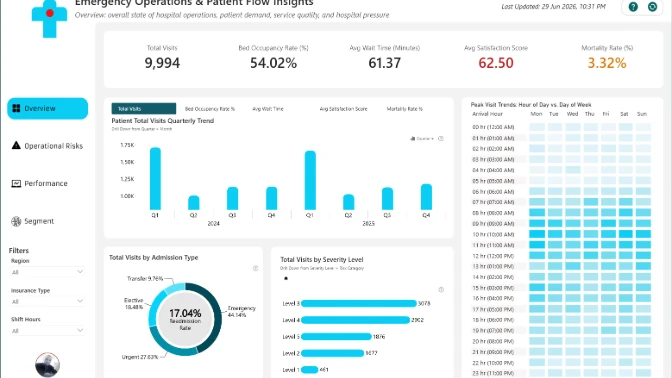
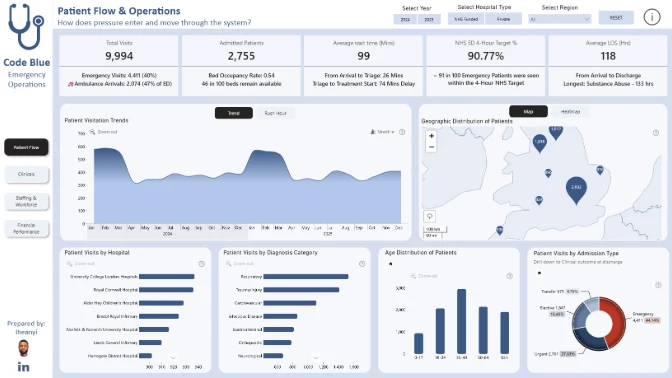
This interactive Power BI report explores the Code Blue Emergency Operations & Patient Flow dataset. It analyzes hospital performance, patient flow, bed capacity, emergency operations, pressure points, risks, inefficiencies, and outcome factors across hospitals and key healthcare segments.
Submitted to the FP20 Analytics ZoomCharts Data Challenge 38: Emergency Operations & Patient Flow Analytics, using native Power BI visuals and ZoomCharts Drill Down PRO custom visuals.
Author’s Description:
Across 11 NHS hospitals, a patient arrives every few minutes — but the system built to receive them is under silent, compounding strain. This report tracks what happens from the moment a patient enters the door to the moment they leave, and connects that journey to the staff carrying the weight and the finances sustaining it. Three pages. One story: emergency demand is rising, night shifts are running with a third fewer doctors than mornings, and staffing already consumes 60 pence of every operational pound — before overtime is counted. Built with ZoomCharts Drill Down Visuals to let decision-makers move from system-wide patterns to individual hospitals in a single click — without switching pages or losing context.
4U Report Challenges
Participate in data challenges, build and submit reports to get free template downloads.
Join CommunityMobile view allows you to interact with the report. To Download the template please switch to desktop view.
Was this helpful? Thank you for your feedback!
Sorry about that.
How can we improve it?