49
Healthcare Capacity Planning Dashboard
Healthcare Capacity Planning Dashboard
More Report pages
Report Author: Akanksha Rani
49
Share template with others
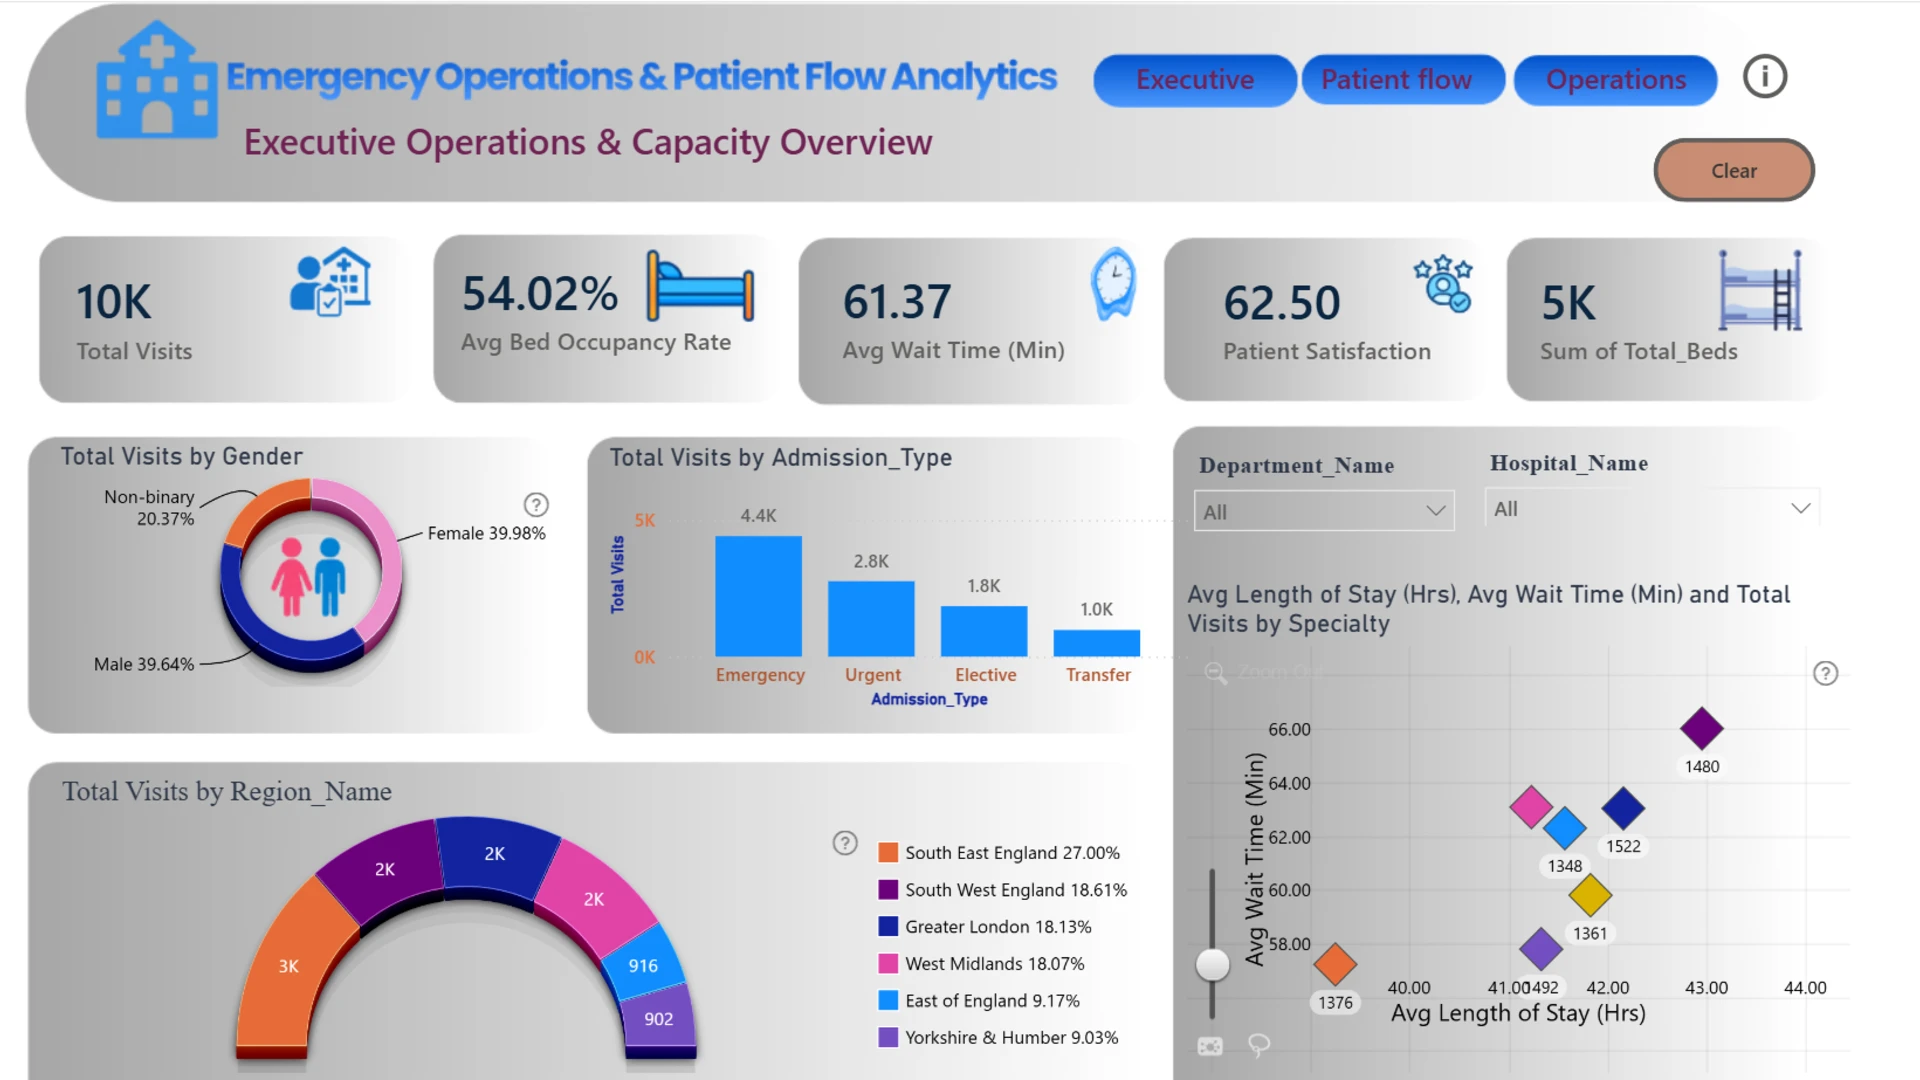
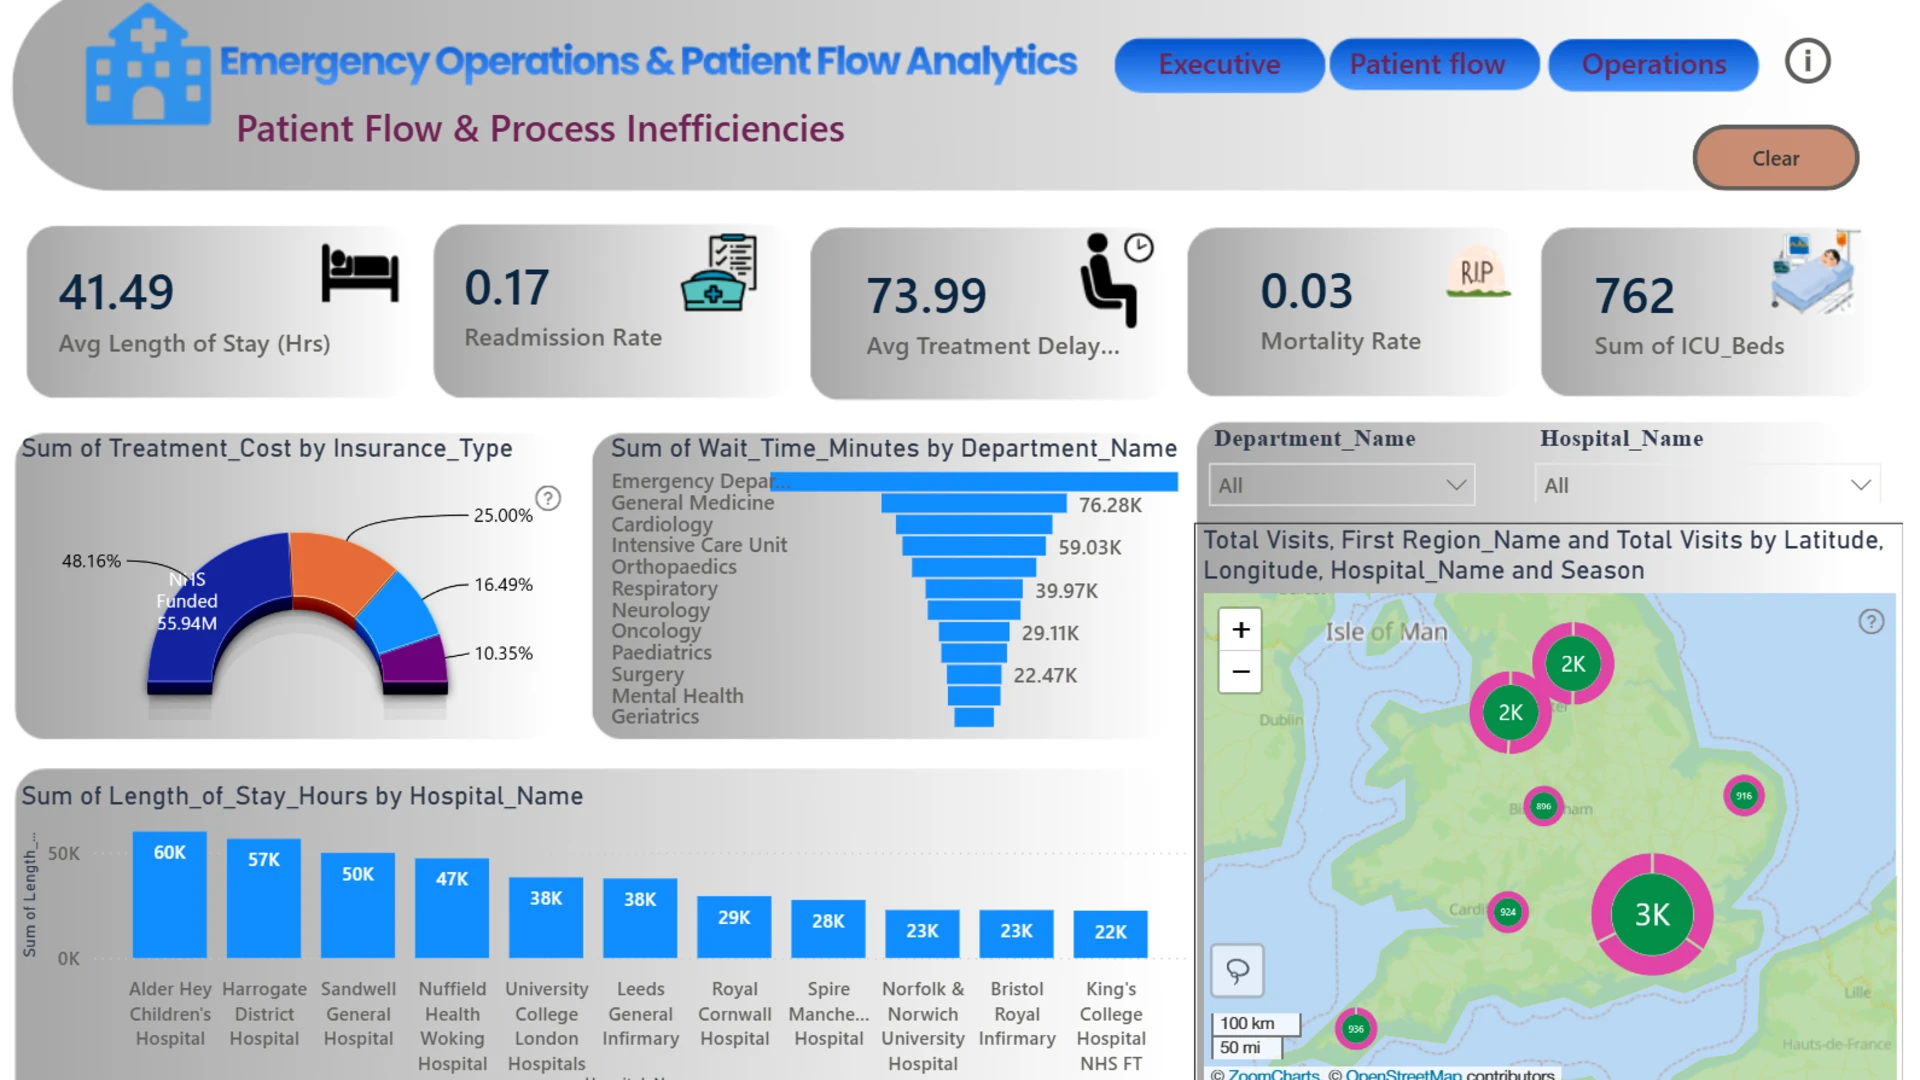
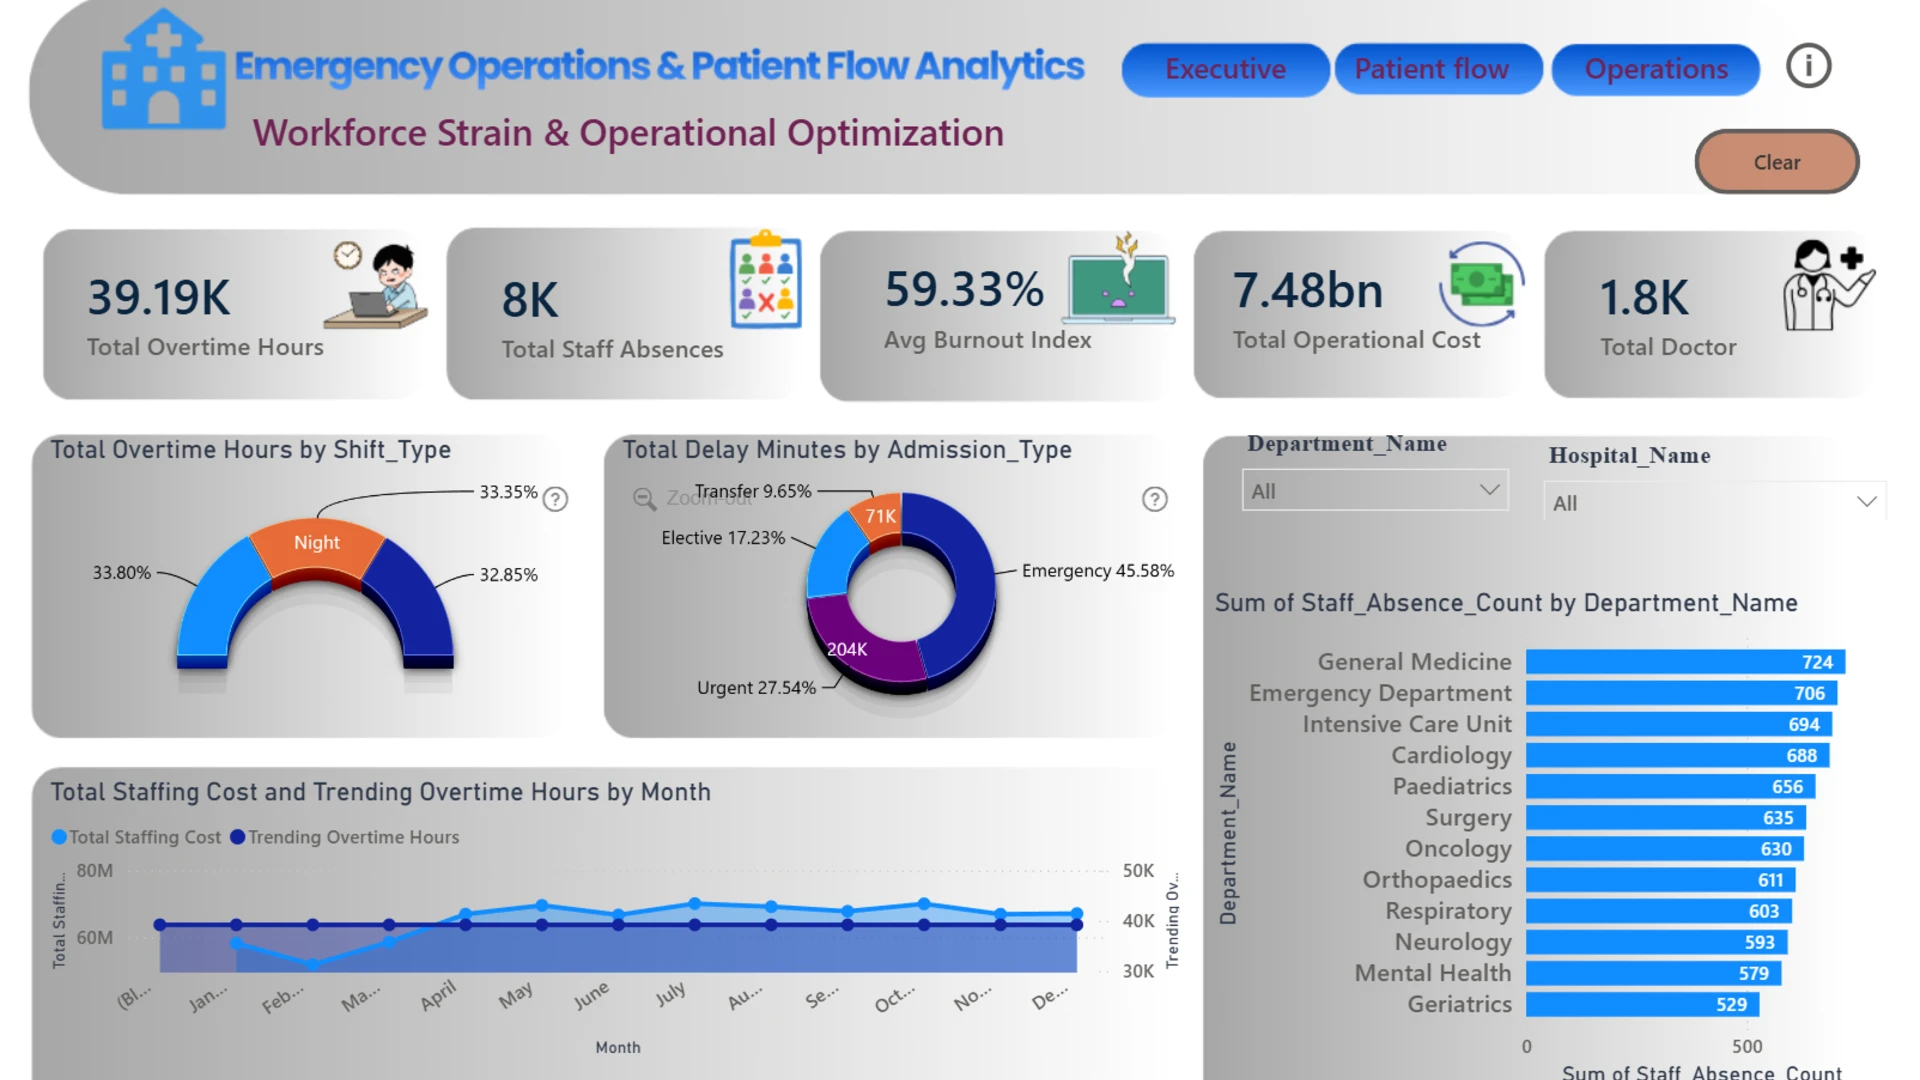
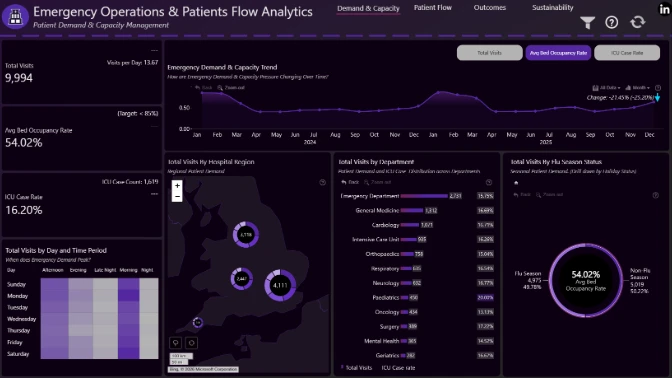
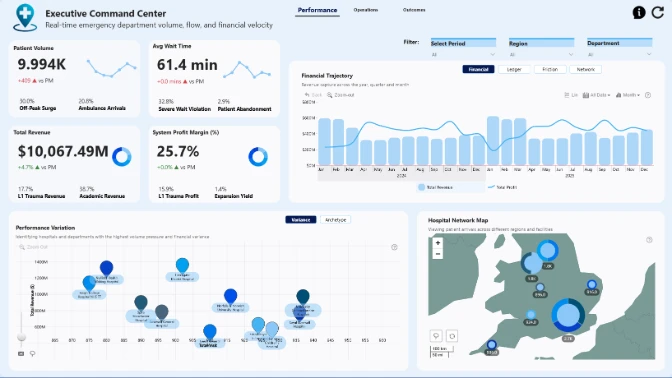
This interactive Power BI report explores the Code Blue Emergency Operations & Patient Flow dataset. It analyzes hospital performance, patient flow, bed capacity, emergency operations, pressure points, risks, inefficiencies, and outcome factors across hospitals and key healthcare segments.
Submitted to the FP20 Analytics ZoomCharts Data Challenge 38: Emergency Operations & Patient Flow Analytics, using native Power BI visuals and ZoomCharts Drill Down PRO custom visuals.
Author’s Description:
I created this dashboard to help hospital leadership see real-time ER metrics like length of stay and department throughput. It cuts through the messy clinical data to show where the operational delays are actually happening.
4U Report Challenges
Participate in data challenges, build and submit reports to get free template downloads.
Join CommunityMobile view allows you to interact with the report. To Download the template please switch to desktop view.
Was this helpful? Thank you for your feedback!
Sorry about that.
How can we improve it?