961
Gym Membership Analysis
Gym Membership Analysis
More Report pages
Report Author: Vincensius Prasetyo Adi
961
Share template with others
This Power BI report uses the Fitness Membership Dataset and features ZoomCharts Drill Down PRO custom visuals for Power BI. It was submitted to the Onyx Data DataDNA ZoomCharts Mini Challenge in August 2025.
Author's Description:
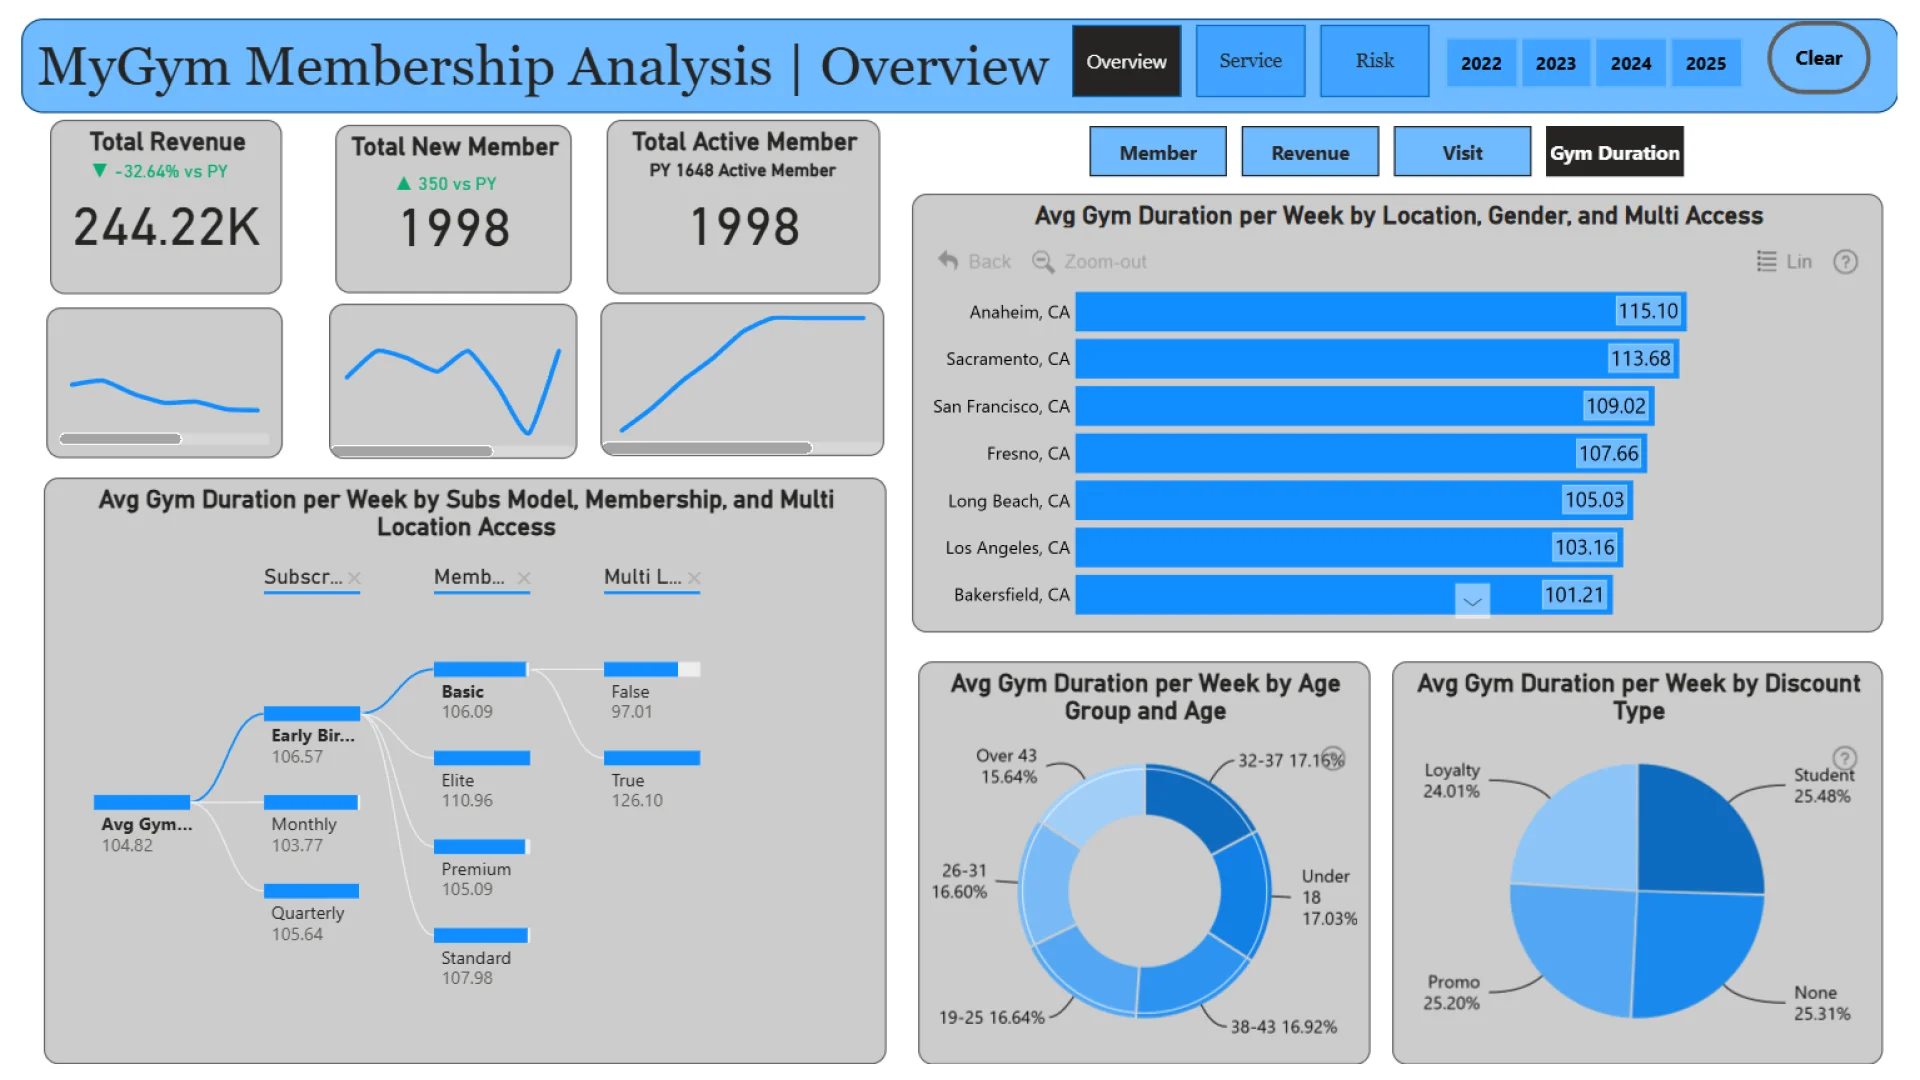
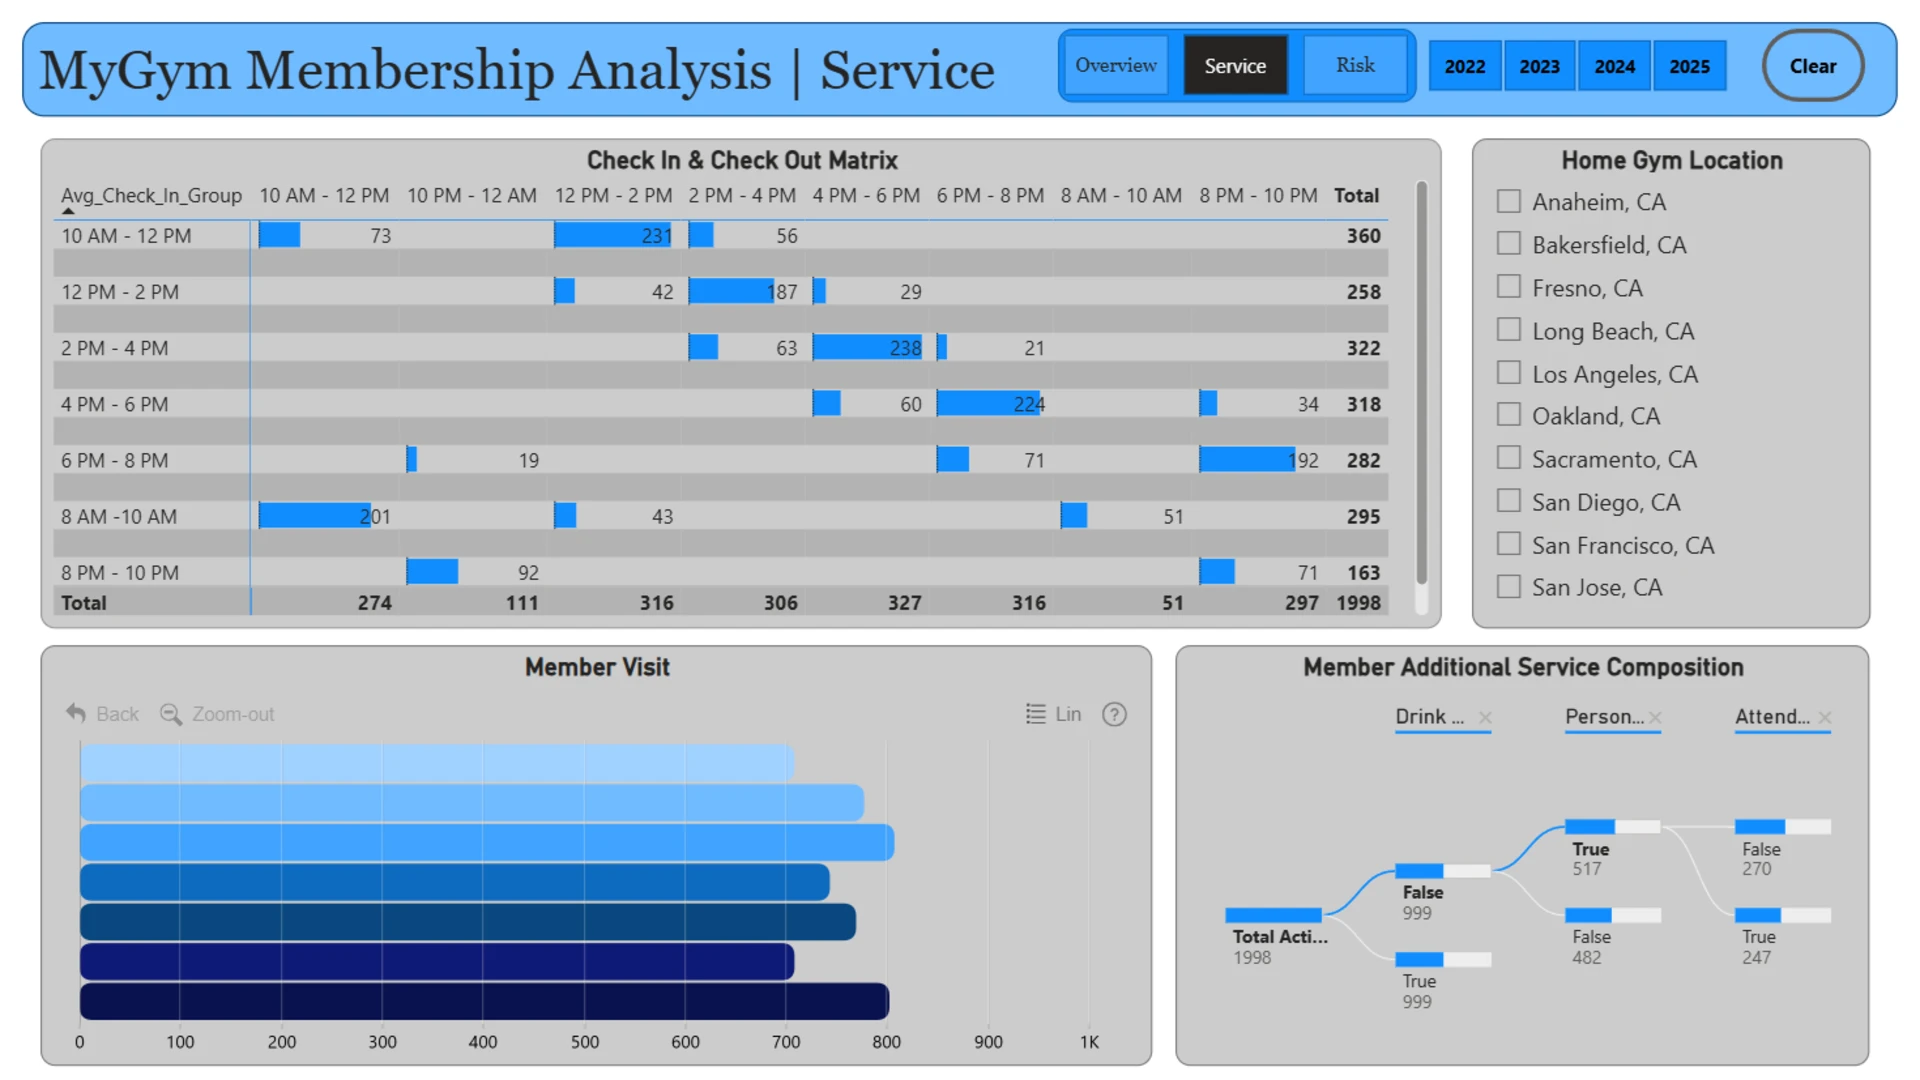
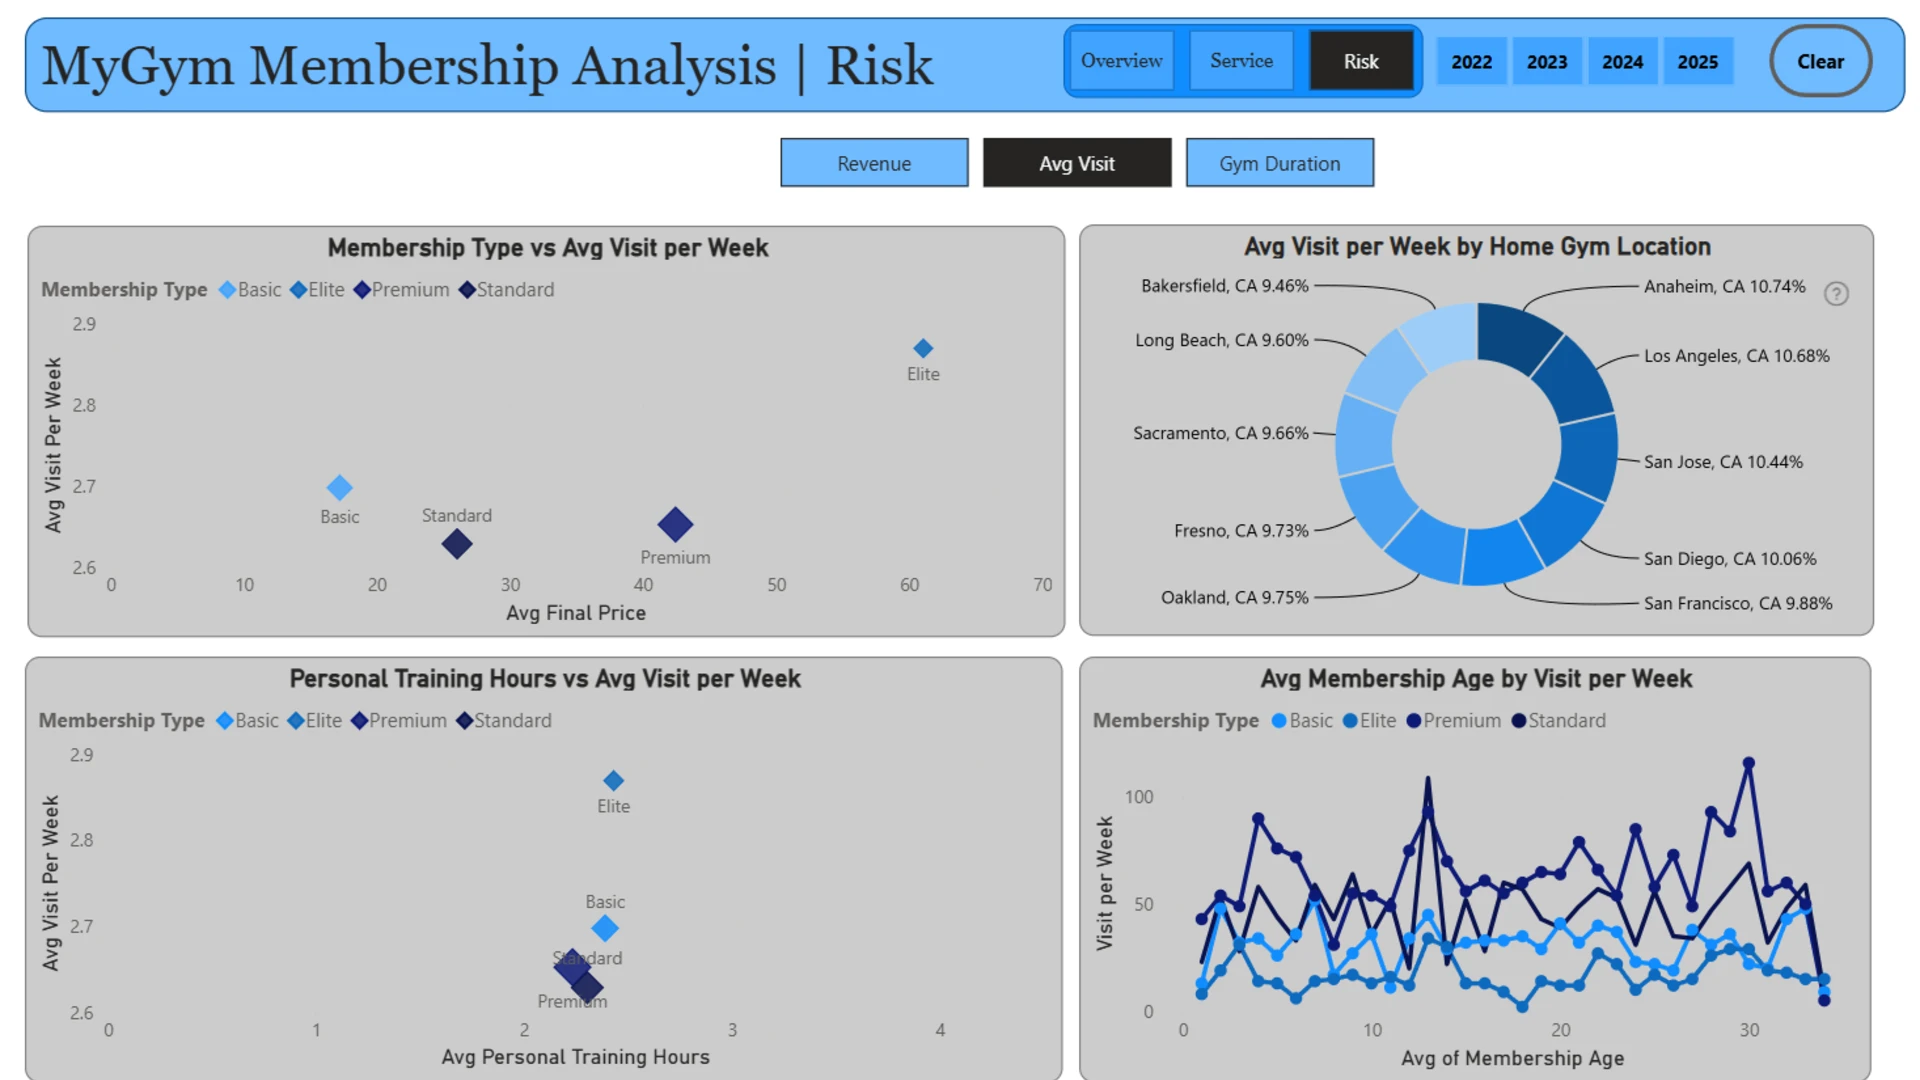
I just completed the Fitness Membership Challenge, taking on the role of a data analyst at MyGym, a rapidly growing fitness chain in California. The goal was to uncover insights and provide strategic recommendations through a three-page Power BI report covering Overview, Service Analysis, and Risk Analysis.
The analysis showed Anaheim, CA leading with the highest gym duration and visits, making it a strong benchmark for other branches. Fresno, CA, while having the highest number of members, showed low subscription uptake, highlighting an opportunity to boost revenue through targeted promotions. San Jose, CA had the fewest members and the lowest gym duration, indicating service gaps where improved staff training, facility upgrades, and weekend promotions could help drive growth.



4U Report Challenges
Participate in data challenges, build and submit reports to get free template downloads.
Join CommunityMobile view allows you to interact with the report. To Download the template please switch to desktop view.
How to use a PBIX template
Preview the interactive report, download the PBIX file, open it in Power BI Desktop, and replace the same data connection with your own dataset.
Preview and download
Explore the report online and download the PBIX template file.
Open in Power BI Desktop
Open the downloaded PBIX file in Power BI Desktop.
Connect your data
Replace the sample data source with your own dataset.
Refresh and adjust
Refresh the model and update fields or visual were needed.
Save and share
Save your report and publish it for your audience.


