686
FP20 Supply Chain Report
FP20 Supply Chain Report
Report Author: Steven Stanford
686
Share template with others
Report submitted for FP20 Analytics ZoomCharts Challenge, October 2023. The report was built with North America Retail Supply Chain and Sales Analysis dataset and includes ZoomCharts custom Drill Down PRO visuals for Power BI.
Author's description:
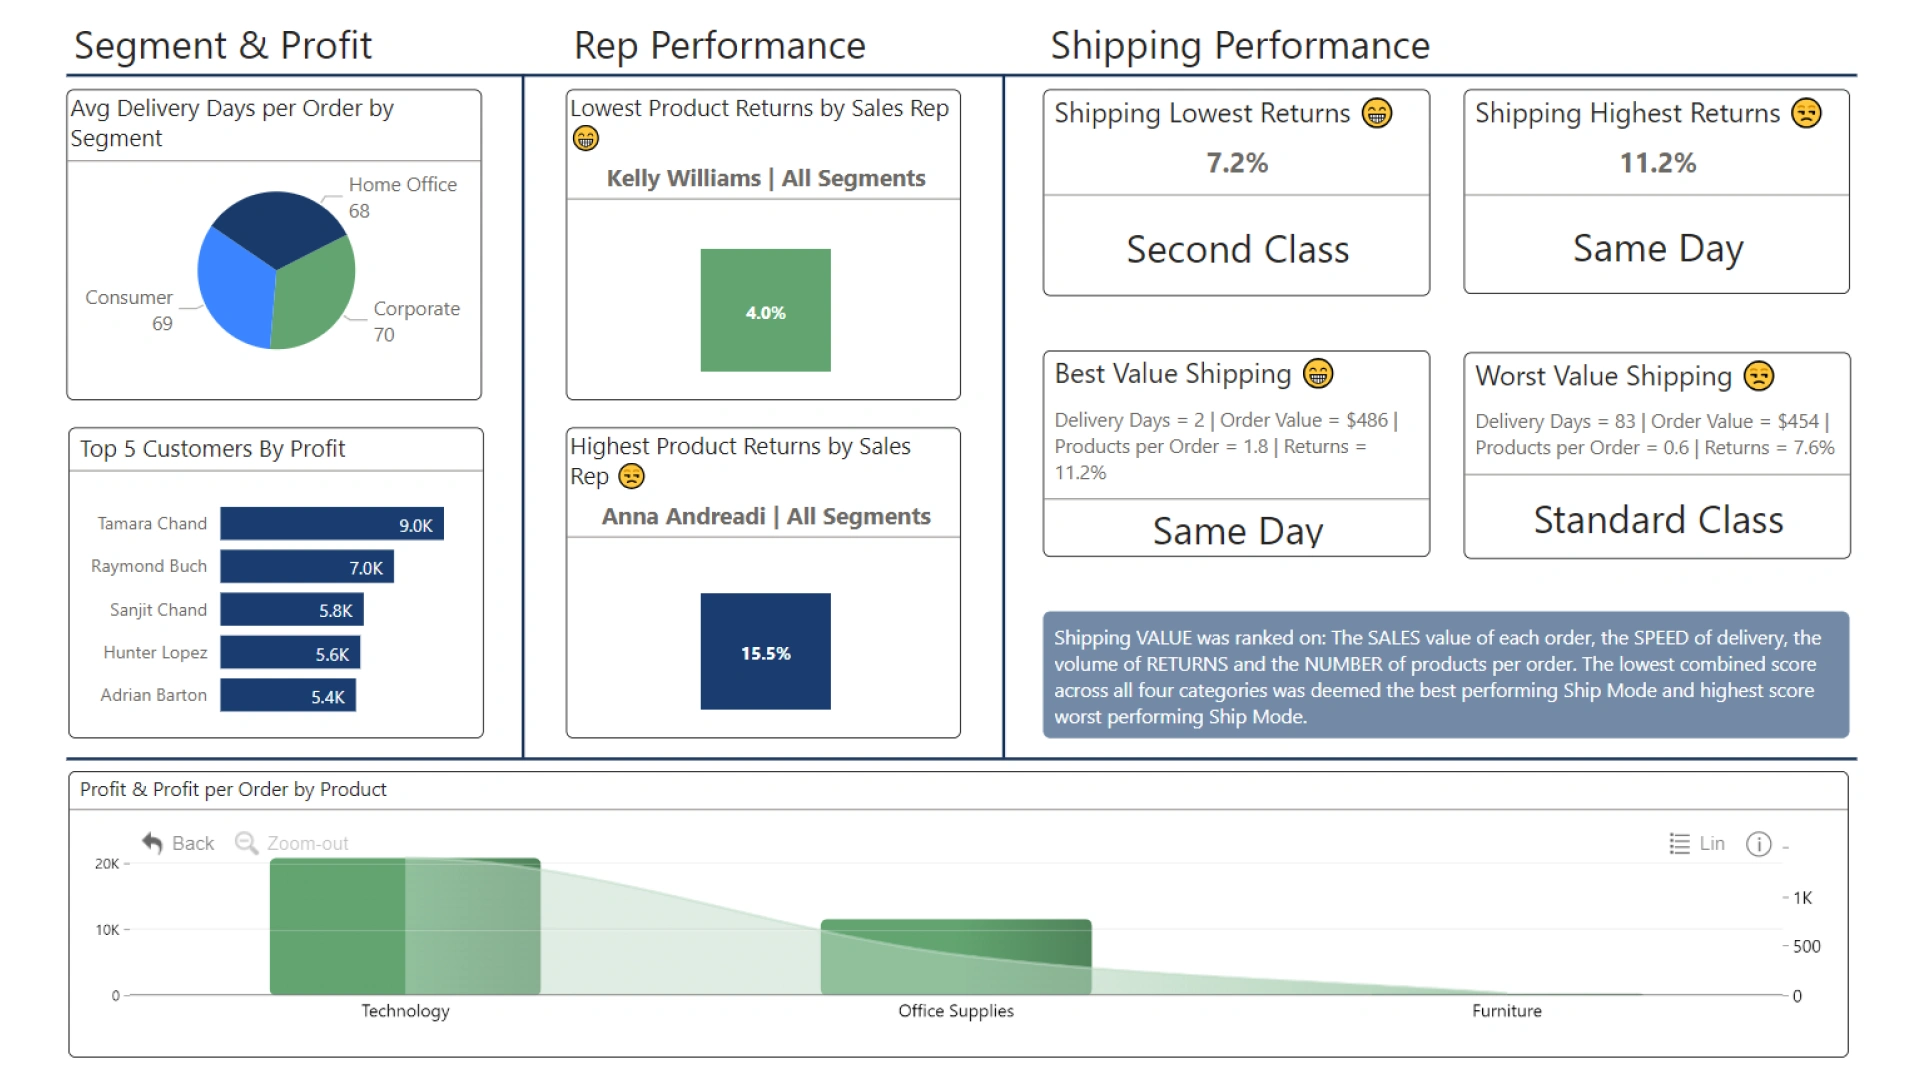
An overview of retail supply performance in the US. Report focuses on identifying top performing cities, states and products by analysing quantity volume, product returns and deliver speed.
ZoomCharts visuals used
4U Report Challenges
Participate in data challenges, build and submit reports to get free template downloads.
Join CommunityMobile view allows you to interact with the report. To Download the template please switch to desktop view.
Was this helpful? Thank you for your feedback!
Sorry about that.
How can we improve it?