logo
For Power BI
  • Products
    • Custom Visuals for Power BI
    • Report Templates
  • Resources

      Resources

    • Documentation
    • Report Examples
    • Blog
    • Webinars
    • Video Tutorials
    • Visuals Gallery

    Support

    • ZoomCharts Assistance
    • Contact Sales
    • Contact Support
    • FAQ

    Challenges

    Challenges

    Improve your report creation skills by participating in free challenges for report creators.

    Learn more
    Get Developer License
  • Services
    • Power BI Report Development
    • Custom Visual Development
  • Challenges
  • Pricing
    • Custom Visuals for Power BI
    • Report Templates
Subscribe
Subscribe
Get it now
Go back

Contents

Contest logo
Contest logo
Contest logo
Contest logo
Try Free Now
Go back

FP20 Analytics April 2024 Challenge

Report Author: Maria Neves

107

FP20 RH Data Analysis Maria Neves

Report
Report Interact

Combo Bar Map Donut Human Resources

Share template with others

Report submitted for FP20 Analytics ZoomCharts Challenge 15 (April 2024). The report was built with the HR Analysis dataset and includes ZoomCharts custom Drill Down PRO visuals for Power BI. 

Author's description:
Some Key Insights:
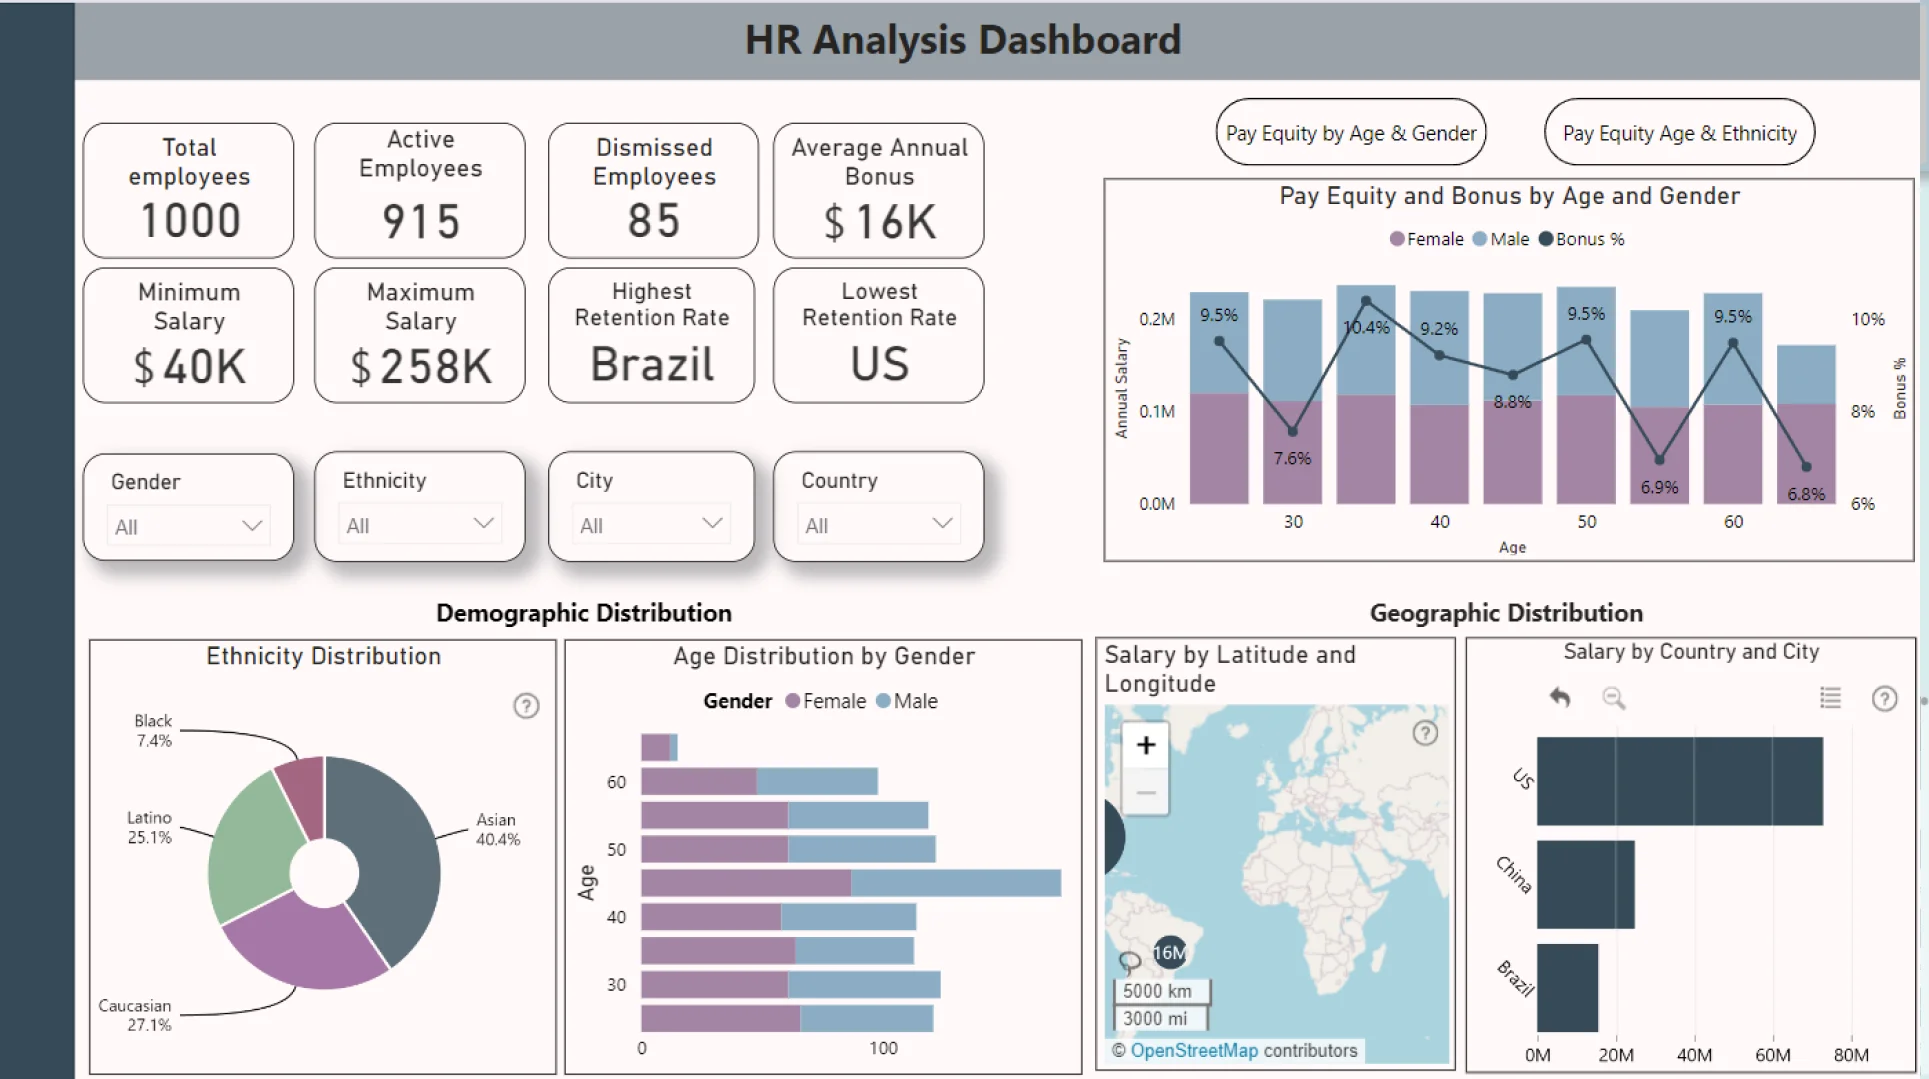
Demographic Distribution: Out of 1000 employees, there are slightly more females than males. The ethnic breakdown shows significant representation of Asian employees, followed by Caucasian, Latino, and Black individuals. This diversity is crucial for fostering an inclusive workplace culture.
Geographic Distribution: Understanding where the workforce is located provides insights into the operational footprint. The majority of employees are based in the United States, highlighting the strategic importance of this market. Analyzing salary sums by location gives us a sense of the economic impact of our workforce distribution, with Seattle emerging as the highest-paying location.
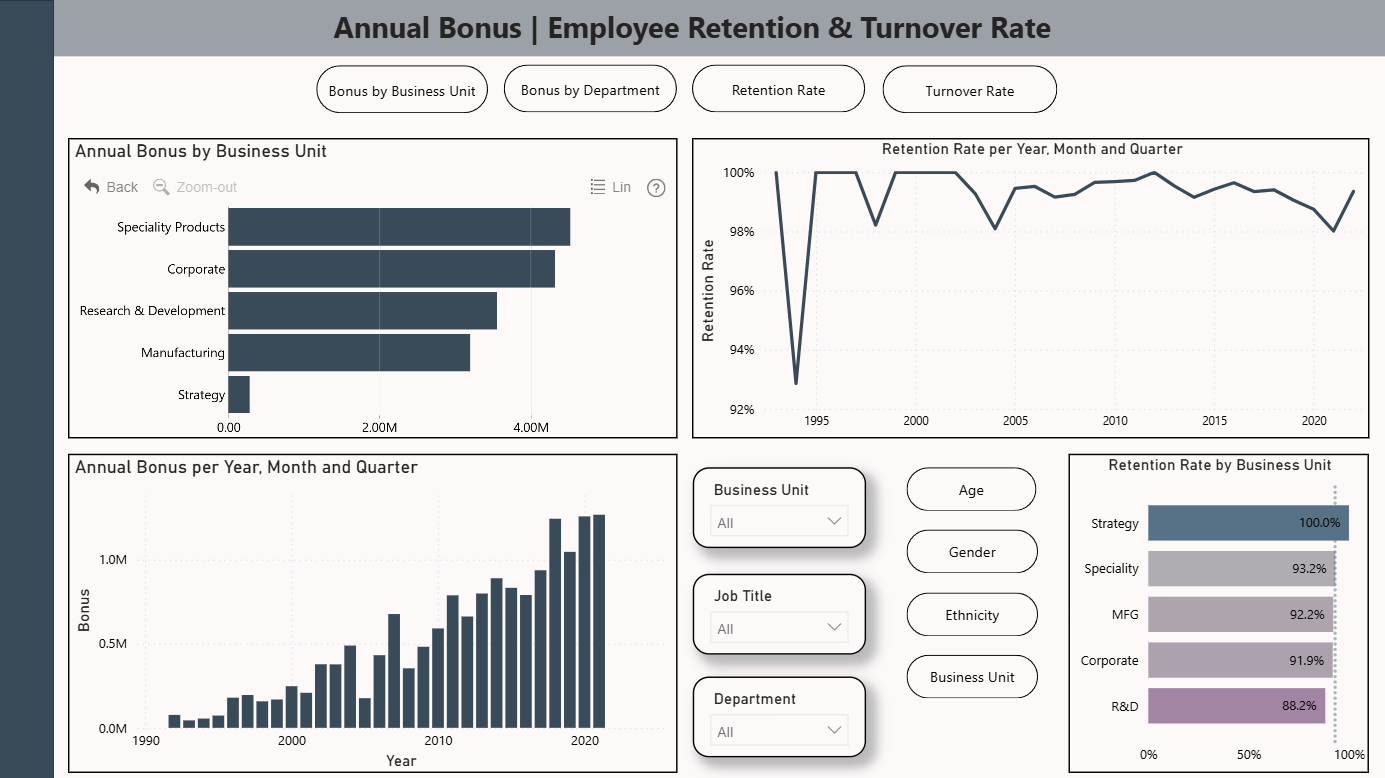
Annual Bonus Insights: Analyzing the distribution of annual bonuses across business units provides valuable insights into our bonus structure. The data reveals that the Marketing department offers the highest average annual bonus, while Strategy has the lowest. This discrepancy may be influenced by the composition of each department.
Retention and Turnover Rate: Retention and turnover rates help us understand how stable the workforce is. We have 915 employees still working in the company, but 85 people have already left. Different retention rates were observed between departments. For instance, the Strategy department boasts the highest retention record, whereas Research and Development face more challenges in this regard. Over the years, fluctuations in turnover rates were observed, with 2021 experiencing a higher turnover compared to 2018. Regarding retention rates by gender and ethnicity, it is possible to observe that females and individuals of Caucasian ethnicity exhibit higher retention rates.

ZoomCharts visuals used

Drill Down Combo Bar PRO Drill Down Combo Bar PRO
Drill Down Map PRO Drill Down Map PRO
Drill Down Donut PRO Drill Down Donut PRO

Need help?

Send your question to ZoomCharts assistant, and we will respond to you as soon as possible.

Contact Us

Mobile view allows you to interact with the report. To Download the template please switch to desktop view.

Report Overhaul

ZoomCharts Academy

Learn ZoomCharts with experts and become certified!

Go to Academy!
Report Overhaul

Was this helpful? Thank you for your feedback!

Sorry about that.

How can we improve it?

FP20 RH Data Analysis Maria Neves

Share

ZoomCharts

Welcome to ZoomCharts

You’re almost there! Create an account to keep your saved reports.

or
Sign up with Microsoft

Verify your email address

We have sent a code to your email address. Please input the code below.

Didn't receive code? Request again (after 30 seconds)

Already have an account? Log in

ZoomCharts

Log in to your ZoomCharts account

Log in with Microsoft
or
Forgot password?

Reset your password

We'll email you instructions on how to reset your password

Don't have an account? Sign up

Please add credits

You have 0 available downloads.
Get more credits or upgrade your plan to continue.

View pricing
logo
[email protected]
+44 204 577 3993
logo

Products

Drill Down Network PRO Drill Down Waterfall PRO Drill Down Graph PRO Drill Down Combo PRO Drill Down Combo Bar PRO Drill Down Donut PRO Drill Down Pie PRO Drill Down TimeSeries PRO Drill Down Timeline PRO Drill Down Map PRO Drill Down Scatter PRO All Visuals

Resources

Report Examples Webinars Blog ZoomCharts Academy Visuals Gallery Documentation Custom Visual Development Subscribe to News

Solutions

Custom Visual Development

Company

Pricing About Us Partners Leave feedback Join PowerGroup EU Funding

Help

ZoomCharts Assistance Contact Sales Contact Support FAQ

Drill Down Network PRO Drill Down Waterfall PRO Drill Down Graph PRO Drill Down Combo PRO Drill Down Combo Bar PRO Drill Down Donut PRO Drill Down Pie PRO Drill Down TimeSeries PRO Drill Down Timeline PRO Drill Down Map PRO Drill Down Scatter PRO All Visuals

Report Examples Webinars Blog ZoomCharts Academy Visuals Gallery Documentation Custom Visual Development Subscribe to News

Custom Visual Development

Pricing About Us Partners Leave feedback Join PowerGroup EU Funding

ZoomCharts Assistance Contact Sales Contact Support FAQ
+44 204 577 3993
[email protected]

Ready to get in touch?

Contact our experts with any question about Power BI and ZoomCharts for Free!

Contact us

© 2025, Data Visualization Software Lab

U.S. Patents No. 11,645,343; 11,921,804; 12,346,389

Cookies
Privacy Policy
Global
Legal
Patent
warning

Error message

success

Success info: Done!

ZoomCharts AI Assistant

We noticed you're using an old OS version.

For the best experience, we recommend upgrading to ensure that all website features display correctly.

Cookie settings

We use necessary cookies for site functionality, as well as statistic, marketing, and preference cookies to enhance your experience. For more information and to manage your preferences, please visit our Cookie policy