896
FP20 Coffee Roasts Analysis
FP20 Coffee Roasts Analysis
Report Author: Magdalena Koszczuk
896
Share template with others
Report submitted for FP20 Analytics ZoomCharts Challenge 16 (May 2024). The report was built with the Coffee Roaster Dataset and includes ZoomCharts custom Drill Down PRO visuals for Power BI.
Author's description:
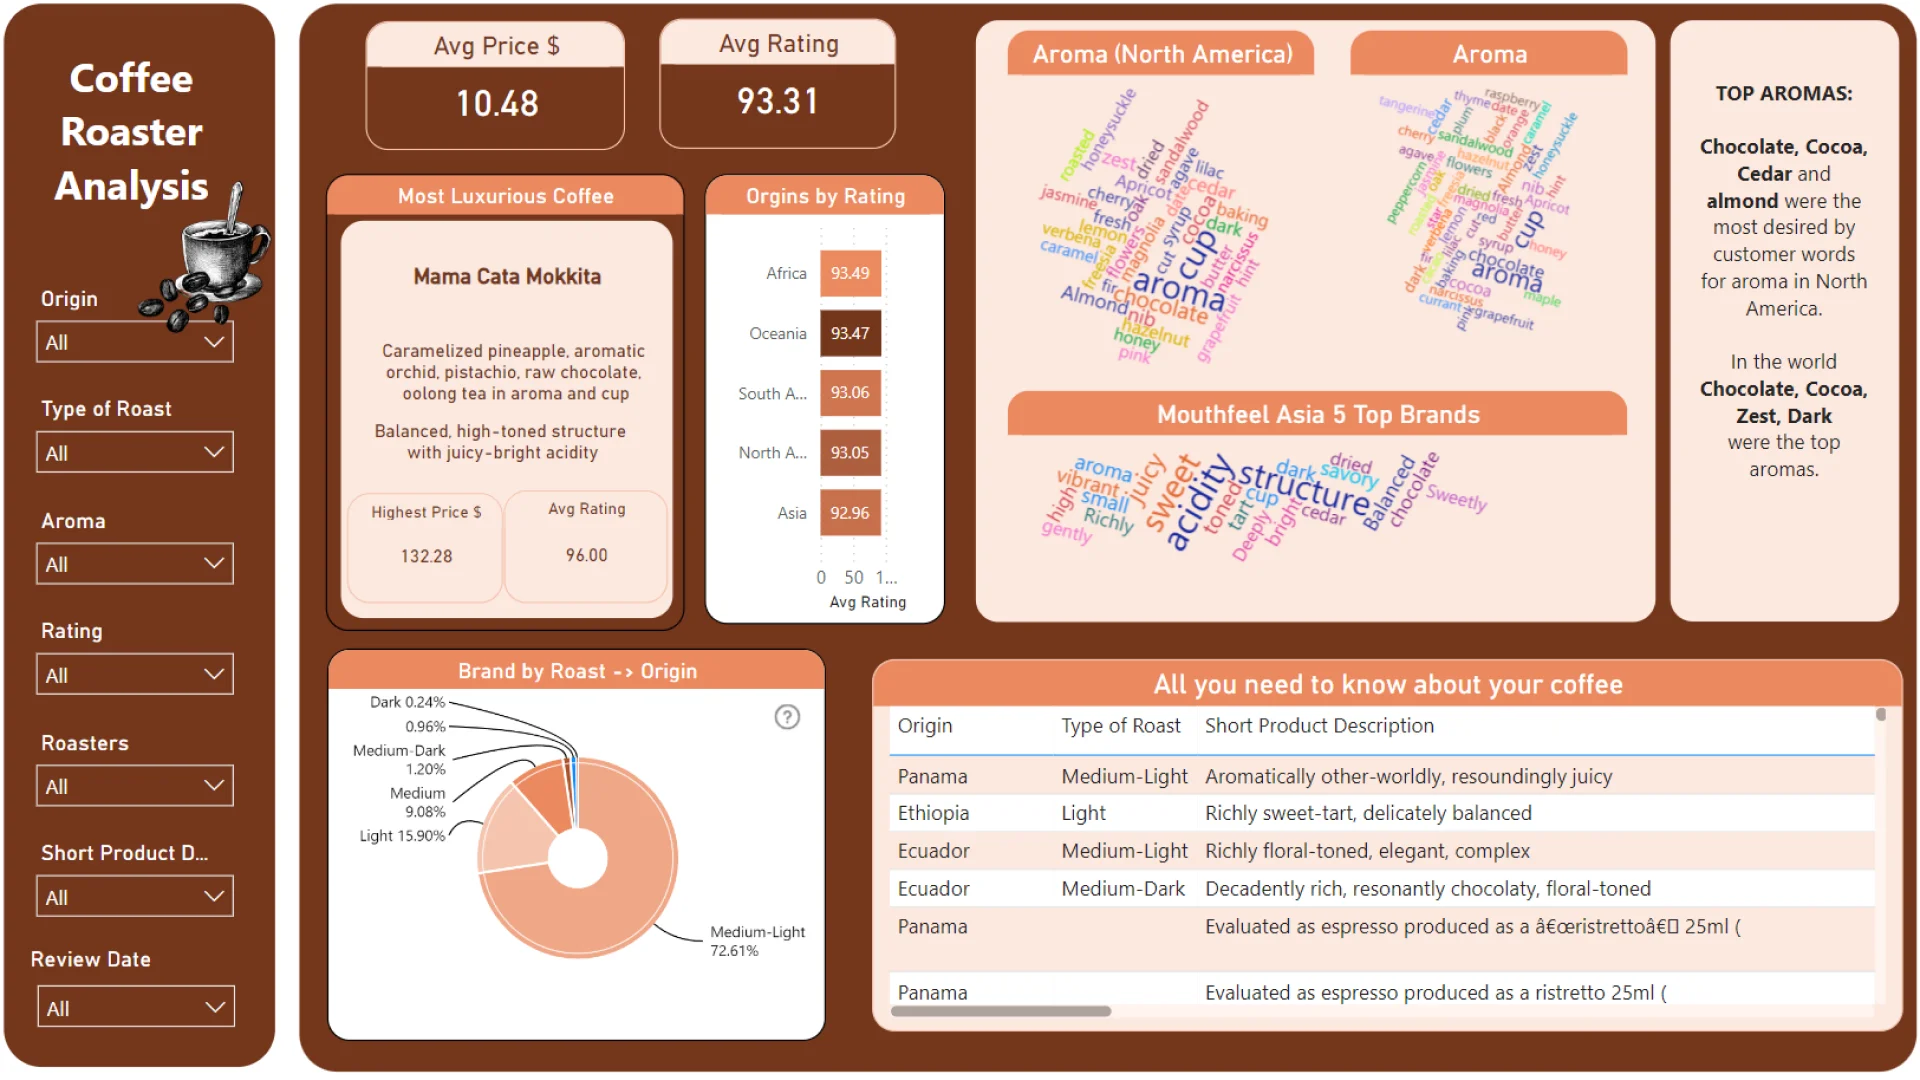
As a coffee lover, I could not say no to participating in FP20 Analytics Challenge 16. This project provides deep analysis of pricing, ratings, performance, and other characteristics of various coffee brands. 🔍 Here are some key insights:
-
Roasting Preferences: Medium-Light is the customer favorite in terms of quantity, Light receives the highest ratings, and Medium-Dark is the most expensive on average.
-
Aroma Preferences: Chocolate, Cocoa, Cedar, and Almond were the most desired aromas by customers in North America. Globally, Zest and Dark swapped positions for 3rd and 4th place.
-
Mouthfeel Preferences: Sweet and acidic profiles receive the highest ratings.
-
Price and Rating Correlation: There is a medium positive correlation between price and rating. Higher prices usually correspond to higher ratings.
-
Best Rated Origins: Africa has the most brands appreciated by customers, with Tanzania consistently winning overall, while Ecuador took the lead in 2022.
-
Roasters: Compos Coffee had the best all-time average rating; however, in 2022, Simon Hsieh Aroma Roast Coffees took the lead.
-
Best Rated Brands: 100% Kona SL-28 leads in all-time ratings, with Colombia Finca El Paraiso leading in 2022.



4U Report Challenges
Participate in data challenges, build and submit reports to get free template downloads.
Join CommunityMobile view allows you to interact with the report. To Download the template please switch to desktop view.
How to use a PBIX template
Preview the interactive report, download the PBIX file, open it in Power BI Desktop, and replace the same data connection with your own dataset.
Preview and download
Explore the report online and download the PBIX template file.
Open in Power BI Desktop
Open the downloaded PBIX file in Power BI Desktop.
Connect your data
Replace the sample data source with your own dataset.
Refresh and adjust
Refresh the model and update fields or visual were needed.
Save and share
Save your report and publish it for your audience.


