339
FP20 Challenge 26 - Financial Statements Analysis (Out of Competition)
FP20 Challenge 26 - Financial Statements Analysis (Out of Competition)
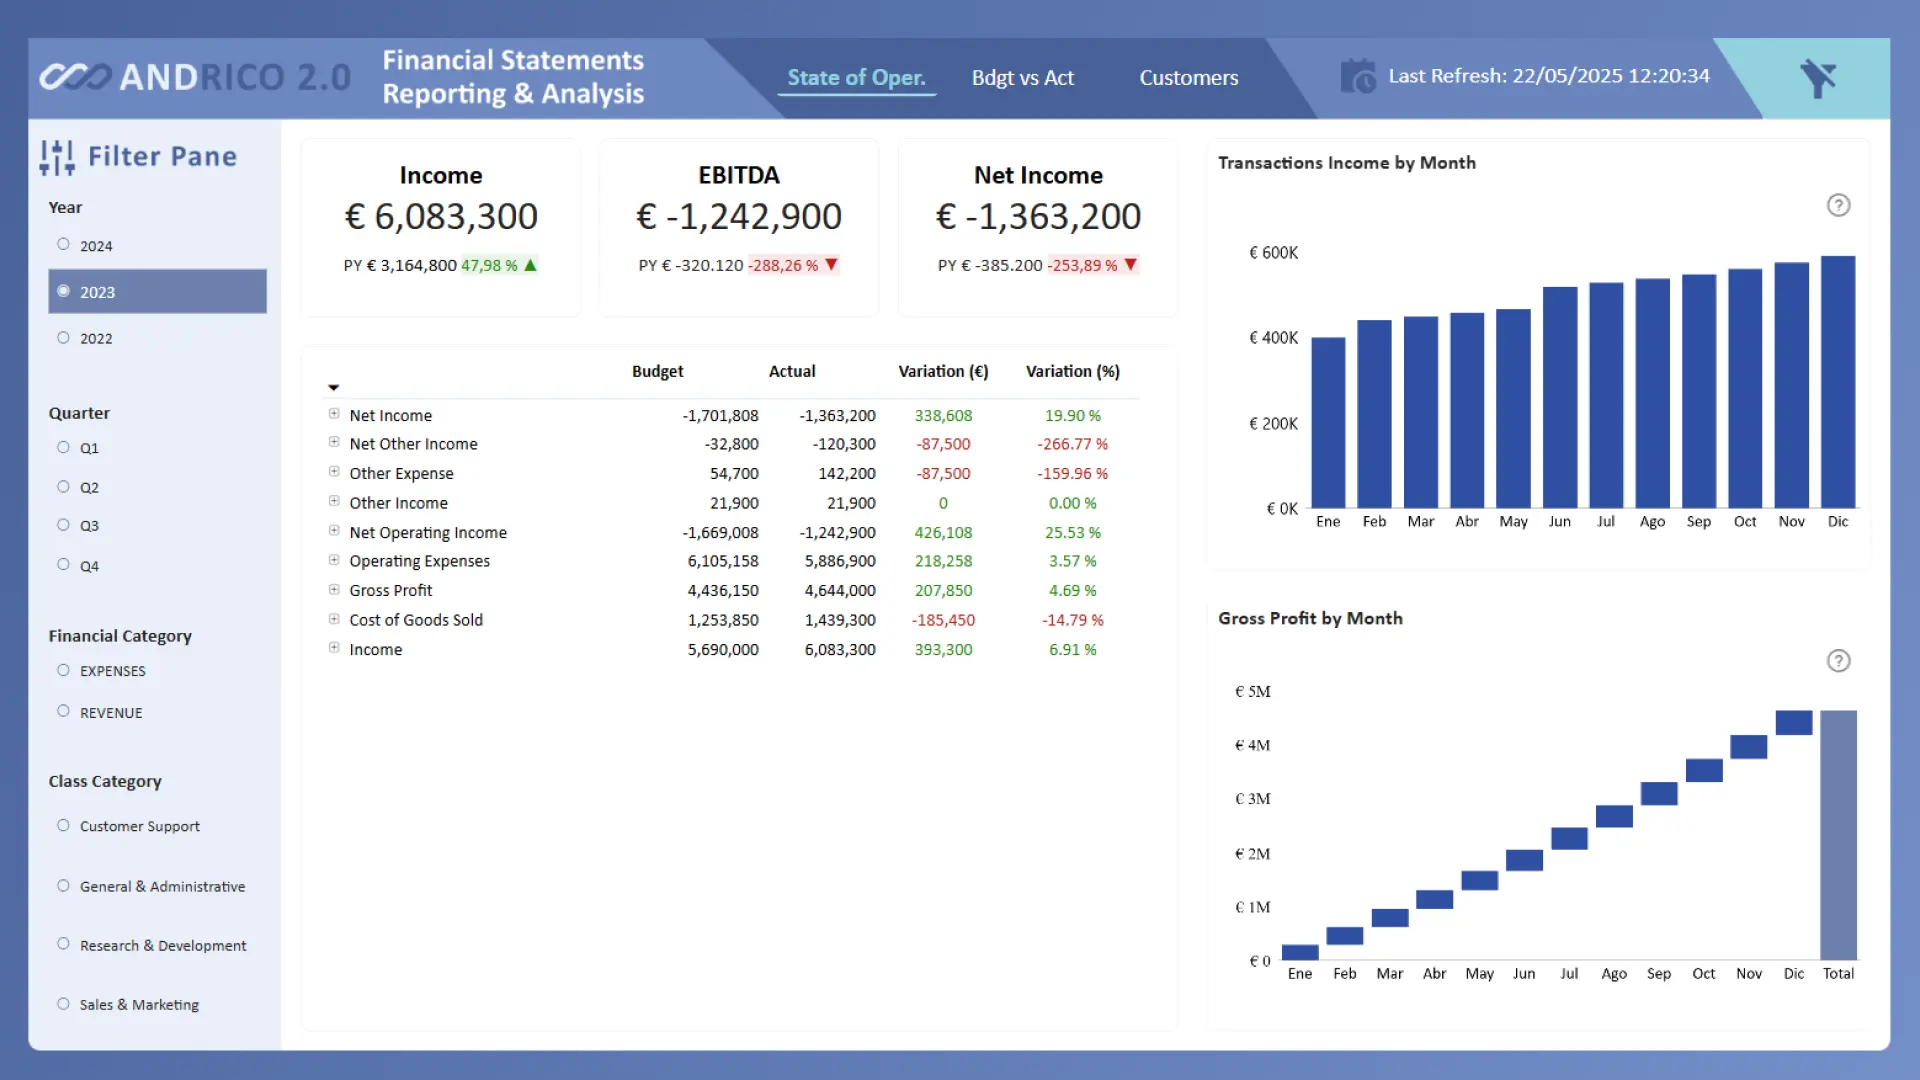
Report Author: Andrés Ruiz Jaén, Federico Pastor
339
Share template with others
Developed in collaboration by Andrés Ruiz Jaén and Federico Pastor
This Power BI report was created for Challenge 26 of the FP20 Analytics Challenges Group, although it was submitted out of competition.
The project reflects our shared goal: to turn traditional financial reporting into a visually engaging and interactive experience, without compromising on accuracy or depth.
Page 1: Executive Summary – featuring core KPIs (Income, EBITDA, Net Income), category-level breakdowns, and monthly comparisons.
Page 2: Advanced Financial Matrix – customized matrices enhanced with embedded SVGs and mini-charts to simplify complex data at a glance.
Page 3: Revenue Explorer – powered by ZoomCharts visuals for an intuitive, drillable view of revenue by customer.
💡 Designed to make financial data analysis faster, clearer, and visually compelling.



4U Report Challenges
Participate in data challenges, build and submit reports to get free template downloads.
Join CommunityMobile view allows you to interact with the report. To Download the template please switch to desktop view.



How to use a PBIX template
Preview the interactive report, download the PBIX file, open it in Power BI Desktop, and replace the same data connection with your own dataset.
Preview and download
Explore the report online and download the PBIX template file.
Open in Power BI Desktop
Open the downloaded PBIX file in Power BI Desktop.
Connect your data
Replace the sample data source with your own dataset.
Refresh and adjust
Refresh the model and update fields or visual were needed.
Save and share
Save your report and publish it for your audience.


