1102
FP20 ANALYTICS | Retail Supply Chain & Sales Analysis 2
FP20 ANALYTICS | Retail Supply Chain & Sales Analysis 2
More Report pages
Report Author: Subham Kumar Sahu
1102
Share template with others
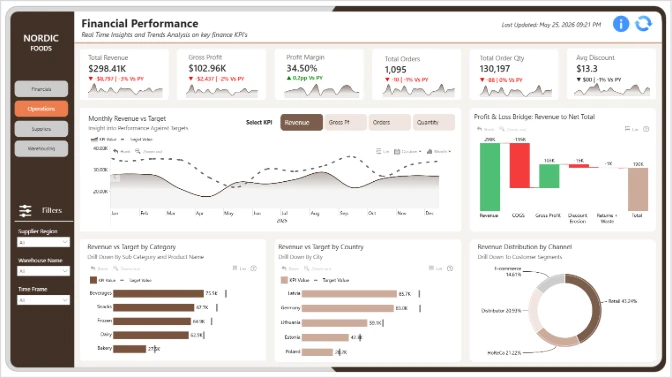
Report submitted for FP20 Analytics ZoomCharts Challenge, October 2023. The report was built with North America Retail Supply Chain and Sales Analysis dataset and includes ZoomCharts custom Drill Down PRO visuals for Power BI.
Author's description:
Objective:
1. Which City/State had the best retail supply chain management?
2. What was the average delivery days for different product category?
3. What was the average delivery days for each segment?
4. What were the 5 fastest delivery products?
5. What were the 5 slowest delivery products?
6. Which salesperson had the lowest return rate?
7. Can we find the correlation between ship mode and return rate?
8. Which ship mode had the lowest/highest return rate?
9. Which top 5 customers made the most profit?
Insights:
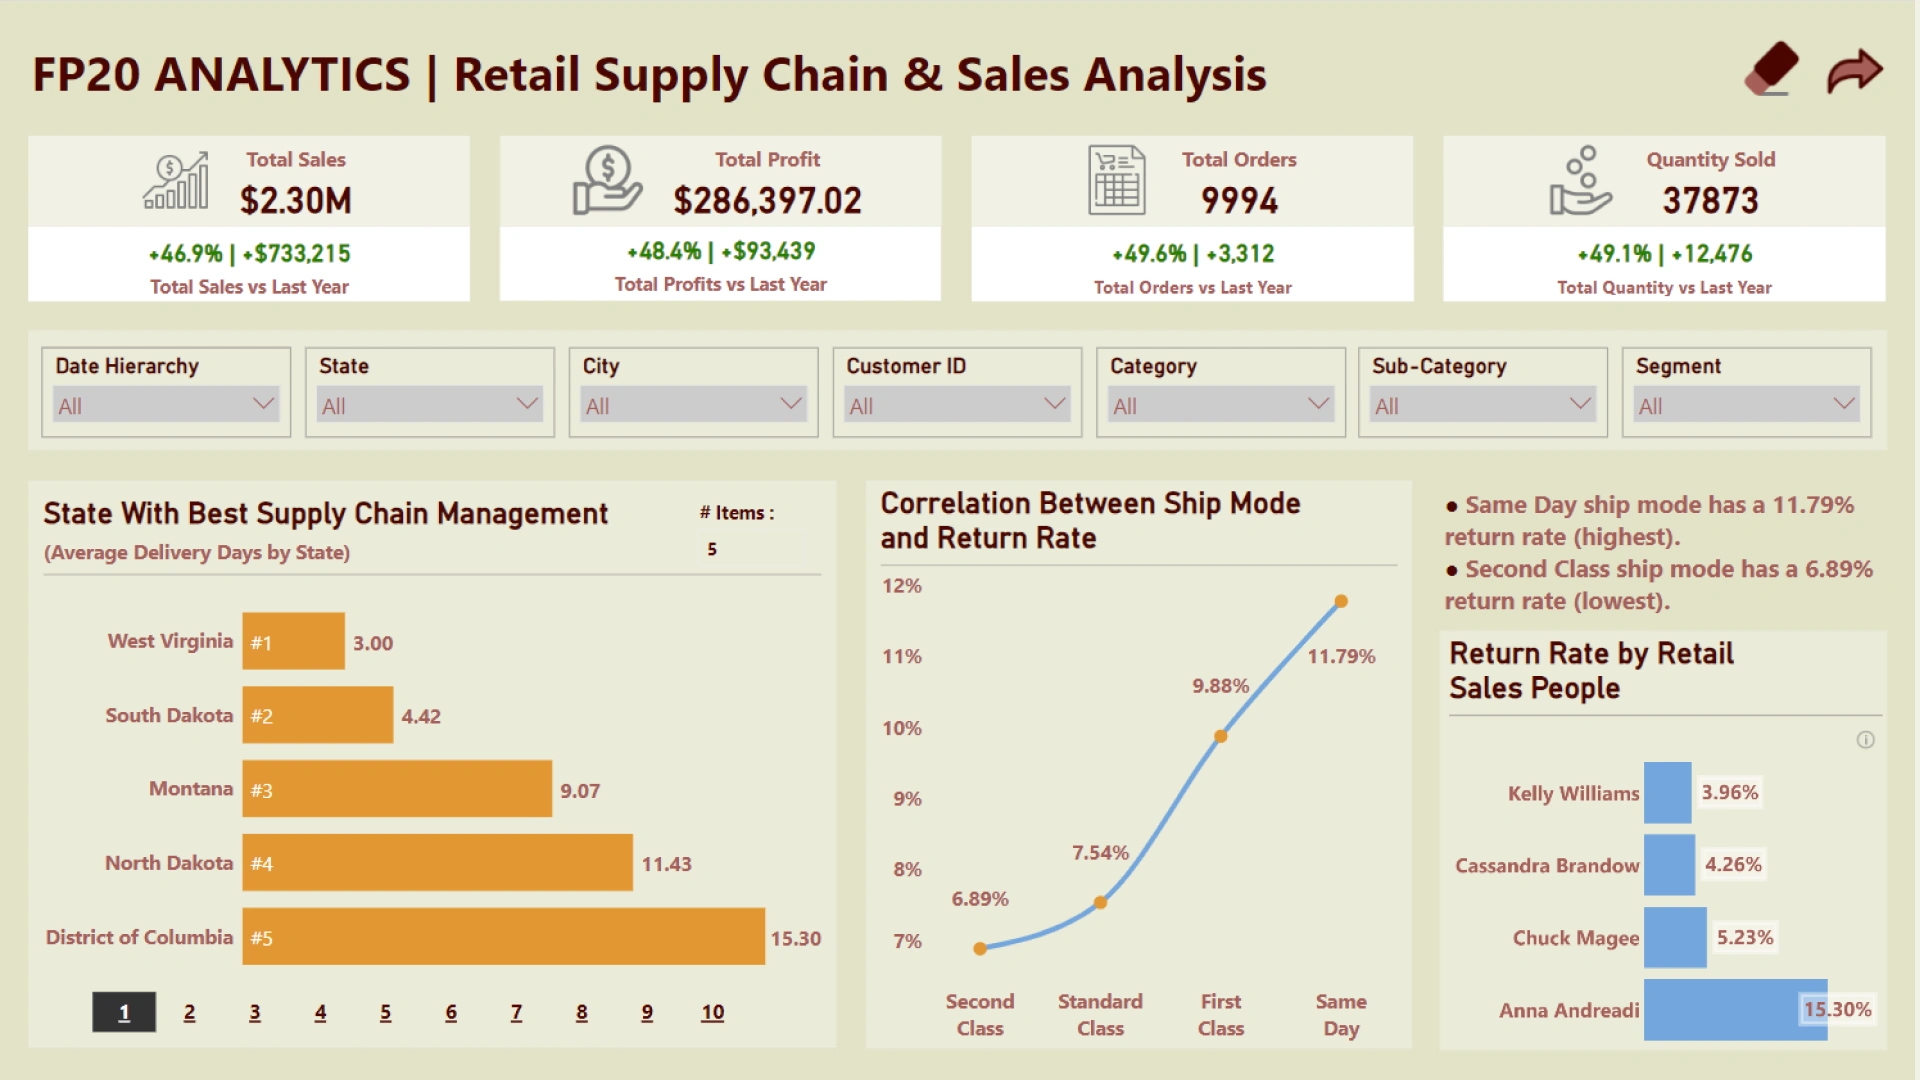
1. West Virginia, with 3 days, is the best city in terms of retail supply chain management as compared to the average of 35 delivery days.
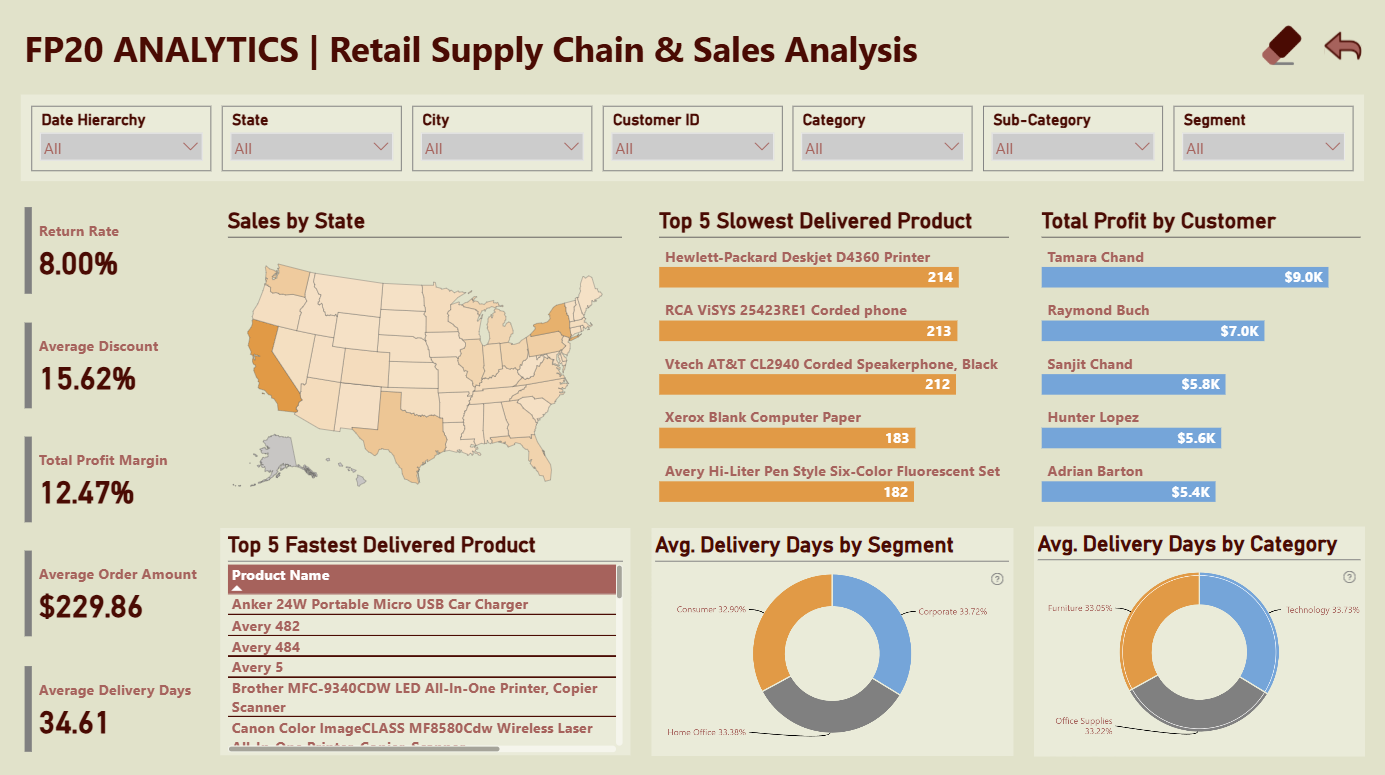
2. Among different categories, furniture has 34.37, office supplies have 34.55, and technology has 35.08 average delivery days.
3. Among different segments Consumer has 34.26, Home Office has 34.76, and Corporate has 35.11 average delivery days.
4. The 5 fastest delivery products are Anker USB Car Charger, Avery 482, Brother Printer, Canon Color Printer, and Cisco IP Phone.
5. The 5 slowest delivery products are the HP D4360 Printer, RCA Coded Phone, Vtech Speakerphone, Xerox Blank Paper, and Avery six-color set.
6. Kelly Williams with 3.96% has the lowest return rate among other salespeople.
7. Same-day ship mode has an 11.79% return rate, and second-class ship mode has a 6.89% return rate, which is the highest among other ship modes.
8. Top 5 customers with the most profit: Tamara Chand ($9.0k), Raymond Buch ($7.0k), Sanjit Chand ($5.8k), Hunter Lopez ($5.6k), and Adrian Barton ($5.4k).
9. California has the highest revenue and profit, followed by New York.
Recommendation:
1. Investigation into the high return rates associated with same-day and first-class delivery ship modes is essential. Understanding the reasons behind these returns—product quality, logistics issues, or packaging concerns—can provide valuable insights for improvement.
2. Timely delivery not only enhances customer retention but also reduces costs associated with delayed shipments. Optimal shipment modes should be explored for future deliveries to ensure orders are received promptly, fostering stronger customer relationships.
Thank you, FP20 Analytics and ZoomCharts, for this opportunity.


4U Report Challenges
Participate in data challenges, build and submit reports to get free template downloads.
Join CommunityMobile view allows you to interact with the report. To Download the template please switch to desktop view.
How to use a PBIX template
Preview the interactive report, download the PBIX file, open it in Power BI Desktop, and replace the same data connection with your own dataset.
Preview and download
Explore the report online and download the PBIX template file.
Open in Power BI Desktop
Open the downloaded PBIX file in Power BI Desktop.
Connect your data
Replace the sample data source with your own dataset.
Refresh and adjust
Refresh the model and update fields or visual were needed.
Save and share
Save your report and publish it for your audience.


