logo
For Power BI
  • Products
    • Custom Visuals for Power BI
    • Report Templates
  • Resources

      Resources

    • Documentation
    • Report Examples
    • Blog
    • Webinars
    • Video Tutorials
    • Visuals Gallery

    Support

    • ZoomCharts Assistance
    • Contact Sales
    • Contact Support
    • FAQ

    Challenges

    Challenges

    Improve your report creation skills by participating in free challenges for report creators.

    Learn more
    Get Developer License
  • Services
    • Power BI Report Development
    • Custom Visual Development
  • Challenges
  • Pricing
    • Custom Visuals for Power BI
    • Report Templates
Subscribe
Subscribe
Get it now
Go back

Contents

Contest logo
Contest logo
Contest logo
Contest logo
Try Free Now
Go back

FP20Analytics October 2023 Challenge

Report Author: Subham Kumar Sahu

75

FP20 ANALYTICS | Retail Supply Chain & Sales Analysis 2

Report
Report Interact

Combo Bar Donut Retail Sales

Share template with others

Report submitted for FP20 Analytics ZoomCharts Challenge, October 2023. The report was built with North America Retail Supply Chain and Sales Analysis dataset and includes ZoomCharts custom Drill Down PRO visuals for Power BI. 

Author's description:
Objective:
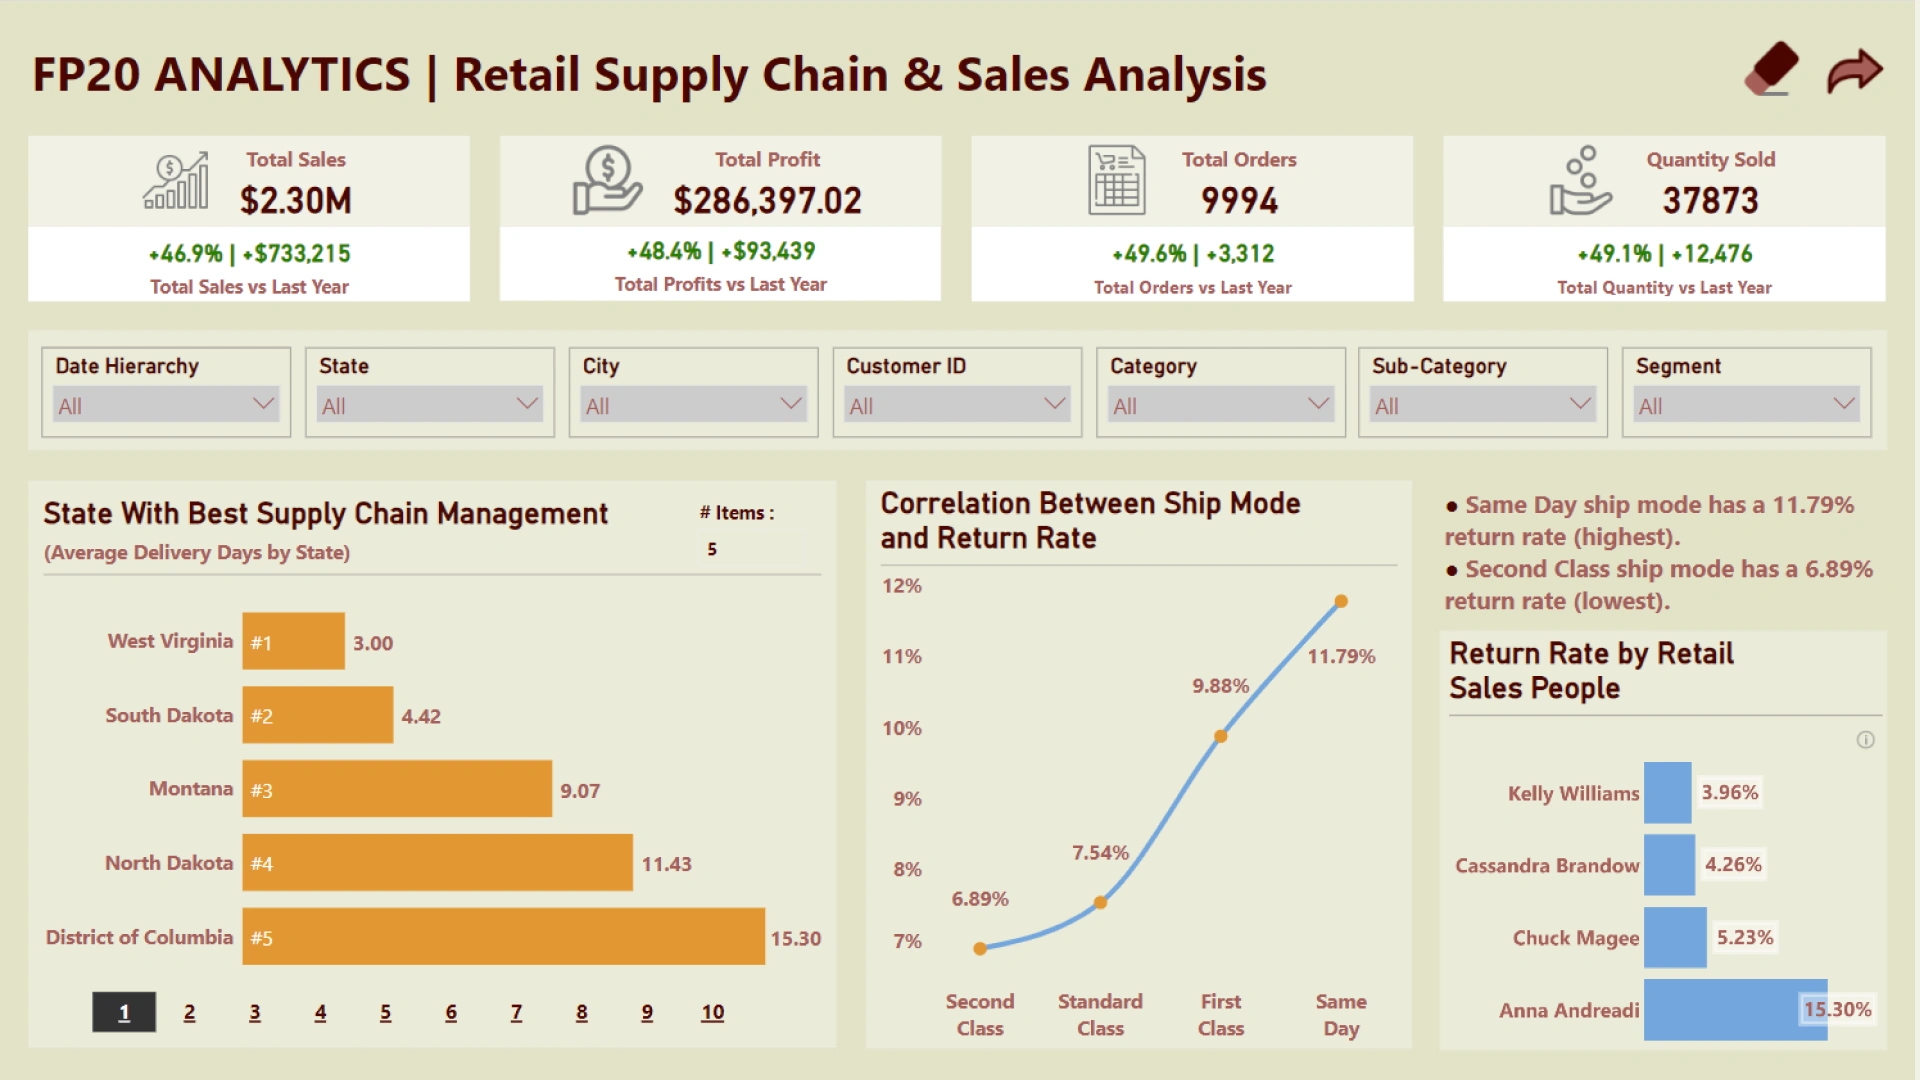
1. Which City/State had the best retail supply chain management?
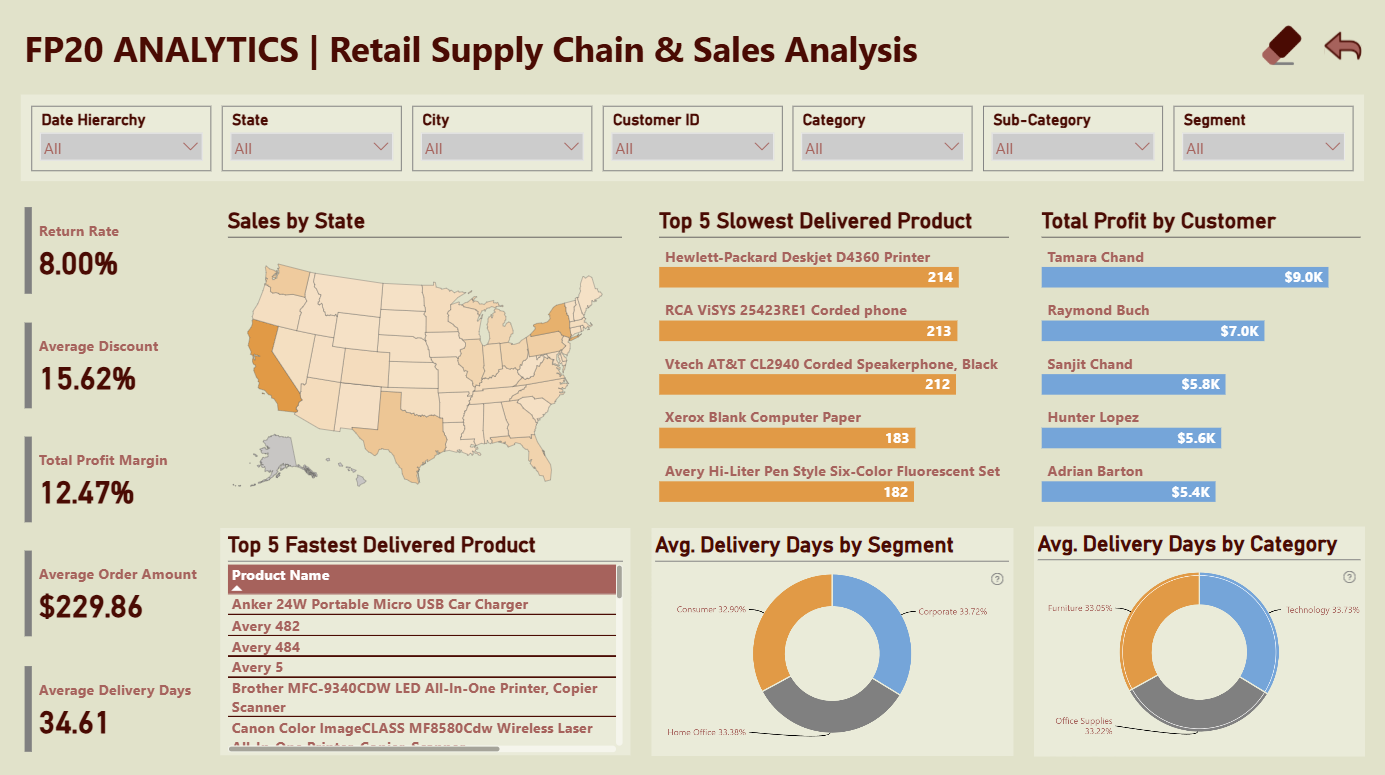
2. What was the average delivery days for different product category?
3. What was the average delivery days for each segment?
4. What were the 5 fastest delivery products?
5. What were the 5 slowest delivery products?
6. Which salesperson had the lowest return rate?
7. Can we find the correlation between ship mode and return rate?
8. Which ship mode had the lowest/highest return rate?
9. Which top 5 customers made the most profit?

Insights:
1. West Virginia, with 3 days, is the best city in terms of retail supply chain management as compared to the average of 35 delivery days.
2. Among different categories, furniture has 34.37, office supplies have 34.55, and technology has 35.08 average delivery days.
3. Among different segments Consumer has 34.26, Home Office has 34.76, and Corporate has 35.11 average delivery days.
4. The 5 fastest delivery products are Anker USB Car Charger, Avery 482, Brother Printer, Canon Color Printer, and Cisco IP Phone.
5. The 5 slowest delivery products are the HP D4360 Printer, RCA Coded Phone, Vtech Speakerphone, Xerox Blank Paper, and Avery six-color set.
6. Kelly Williams with 3.96% has the lowest return rate among other salespeople.
7. Same-day ship mode has an 11.79% return rate, and second-class ship mode has a 6.89% return rate, which is the highest among other ship modes.
8. Top 5 customers with the most profit: Tamara Chand ($9.0k), Raymond Buch ($7.0k), Sanjit Chand ($5.8k), Hunter Lopez ($5.6k), and Adrian Barton ($5.4k).
9. California has the highest revenue and profit, followed by New York.

Recommendation:
1. Investigation into the high return rates associated with same-day and first-class delivery ship modes is essential. Understanding the reasons behind these returns—product quality, logistics issues, or packaging concerns—can provide valuable insights for improvement.
2. Timely delivery not only enhances customer retention but also reduces costs associated with delayed shipments. Optimal shipment modes should be explored for future deliveries to ensure orders are received promptly, fostering stronger customer relationships.
Thank you, FP20 Analytics and ZoomCharts, for this opportunity.

ZoomCharts visuals used

Drill Down Combo Bar PRO Drill Down Combo Bar PRO
Drill Down Donut PRO Drill Down Donut PRO

Need help?

Send your question to ZoomCharts assistant, and we will respond to you as soon as possible.

Contact Us

Mobile view allows you to interact with the report. To Download the template please switch to desktop view.

Report Overhaul

ZoomCharts Academy

Learn ZoomCharts with experts and become certified!

Go to Academy!
Report Overhaul

Was this helpful? Thank you for your feedback!

Sorry about that.

How can we improve it?

FP20 ANALYTICS | Retail Supply Chain & Sales Analysis 2

Share

ZoomCharts

Welcome to ZoomCharts

You’re almost there! Create an account to keep your saved reports.

or
Sign up with Microsoft

Verify your email address

We have sent a code to your email address. Please input the code below.

Didn't receive code? Request again (after 30 seconds)

Already have an account? Log in

ZoomCharts

Log in to your ZoomCharts account

Log in with Microsoft
or
Forgot password?

Reset your password

We'll email you instructions on how to reset your password

Don't have an account? Sign up

Please add credits

You have 0 available downloads.
Get more credits or upgrade your plan to continue.

View pricing
logo
[email protected]
+44 204 577 3993
logo

Products

Drill Down Network PRO Drill Down Waterfall PRO Drill Down Graph PRO Drill Down Combo PRO Drill Down Combo Bar PRO Drill Down Donut PRO Drill Down Pie PRO Drill Down TimeSeries PRO Drill Down Timeline PRO Drill Down Map PRO Drill Down Scatter PRO All Visuals

Resources

Report Examples Webinars Blog ZoomCharts Academy Visuals Gallery Documentation Custom Visual Development Subscribe to News

Solutions

Custom Visual Development

Company

Pricing About Us Partners Leave feedback Join PowerGroup EU Funding

Help

ZoomCharts Assistance Contact Sales Contact Support FAQ

Drill Down Network PRO Drill Down Waterfall PRO Drill Down Graph PRO Drill Down Combo PRO Drill Down Combo Bar PRO Drill Down Donut PRO Drill Down Pie PRO Drill Down TimeSeries PRO Drill Down Timeline PRO Drill Down Map PRO Drill Down Scatter PRO All Visuals

Report Examples Webinars Blog ZoomCharts Academy Visuals Gallery Documentation Custom Visual Development Subscribe to News

Custom Visual Development

Pricing About Us Partners Leave feedback Join PowerGroup EU Funding

ZoomCharts Assistance Contact Sales Contact Support FAQ
+44 204 577 3993
[email protected]

Ready to get in touch?

Contact our experts with any question about Power BI and ZoomCharts for Free!

Contact us

© 2025, Data Visualization Software Lab

U.S. Patents No. 11,645,343; 11,921,804; 12,346,389

Cookies
Privacy Policy
Global
Legal
Patent
warning

Error message

success

Success info: Done!

ZoomCharts AI Assistant

We noticed you're using an old OS version.

For the best experience, we recommend upgrading to ensure that all website features display correctly.

Cookie settings

We use necessary cookies for site functionality, as well as statistic, marketing, and preference cookies to enhance your experience. For more information and to manage your preferences, please visit our Cookie policy