1023
FP20 Analytics February 2025 Challenge
FP20 Analytics February 2025 Challenge
More Report pages
Report Author: Md Mizanur Rahman Nayan
1023
Share template with others
Report submitted for the FP20 Analytics ZoomCharts Challenge, February 2025. The report was built using the Transportation & Logistics Dataset and includes ZoomCharts custom Drill Down PRO visuals for Power BI.
Author's Description
As the dataset was rich with information, the first question I asked myself was: Who will need to see my report, and what will they be looking for?
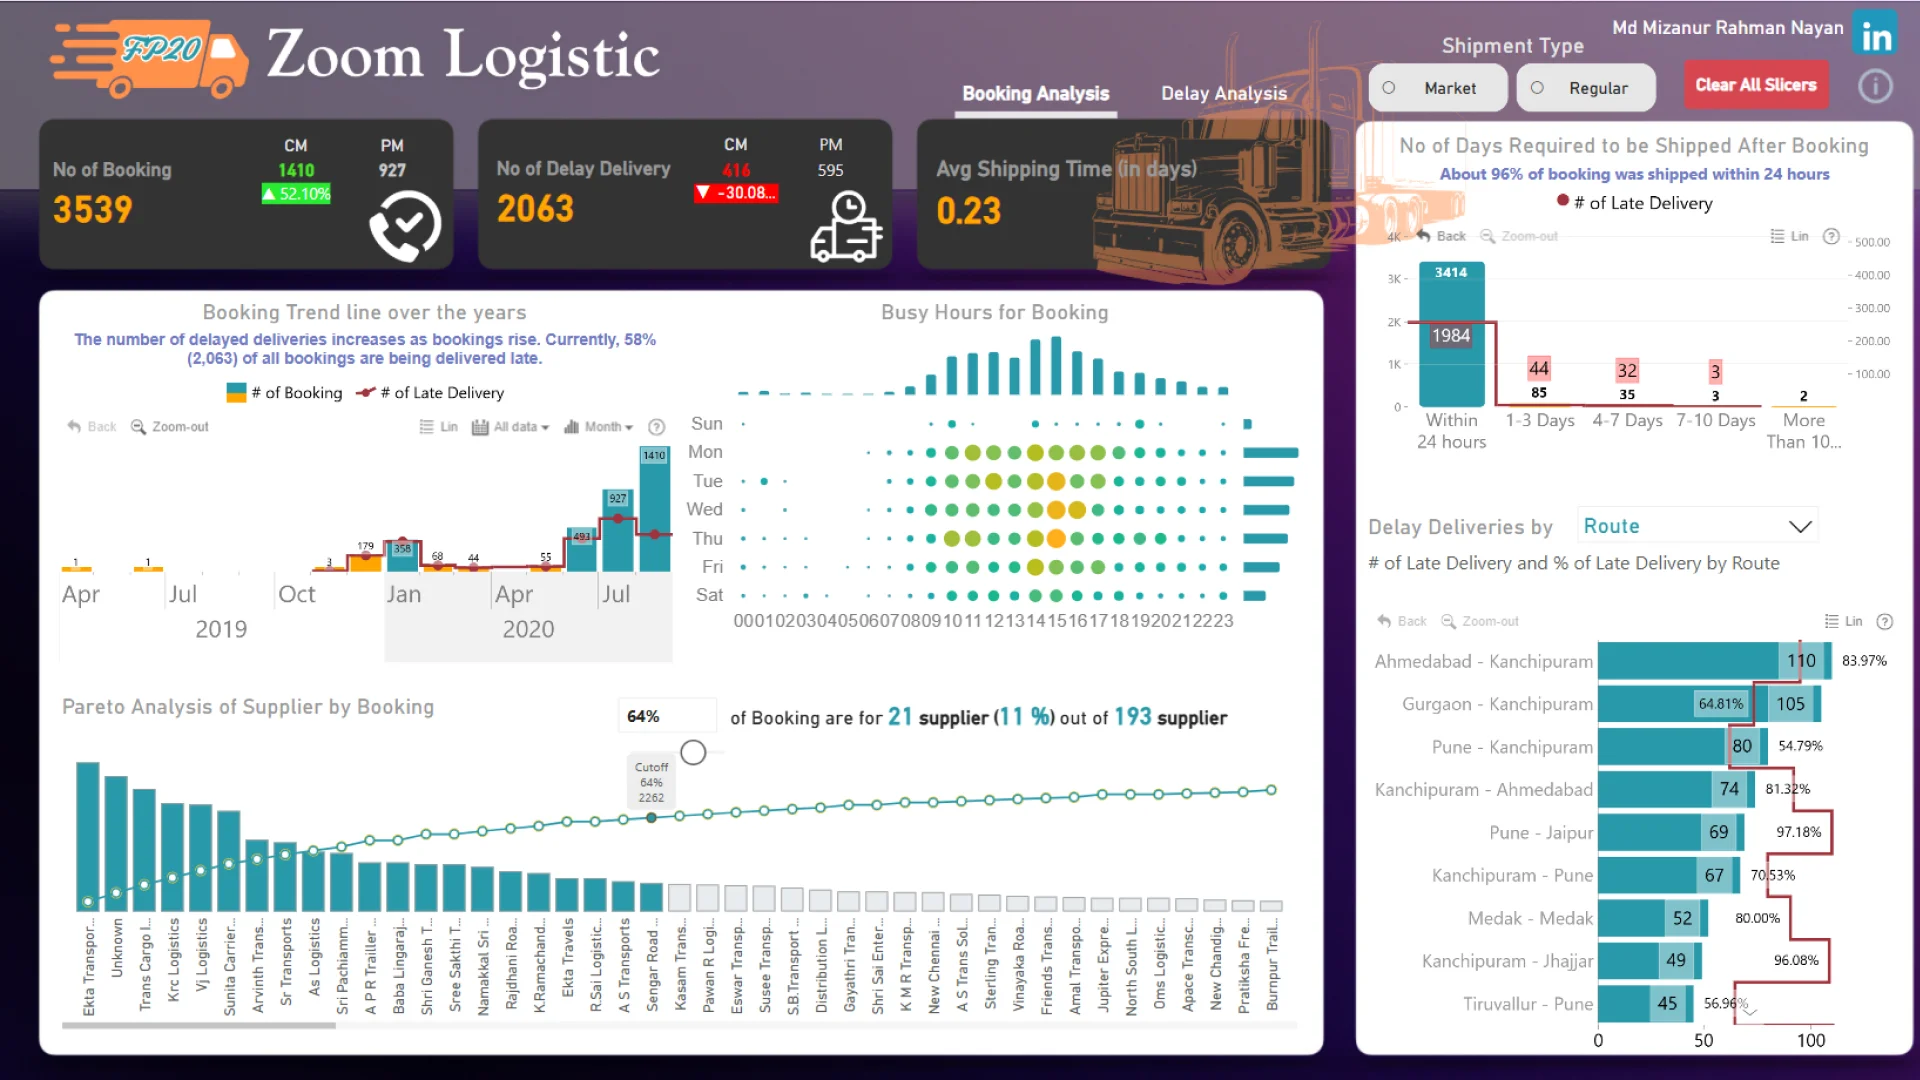
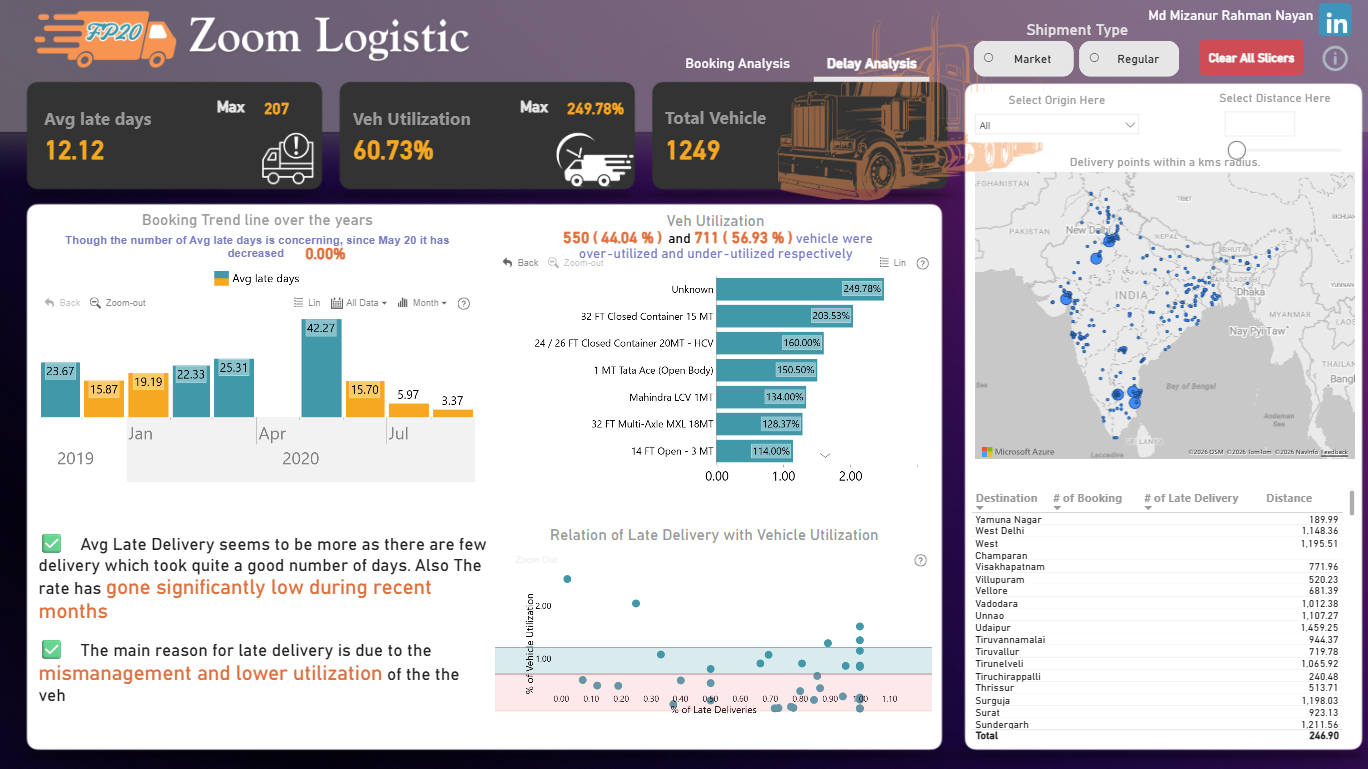
First, I tried to identify where the problem was. After extensive exploratory analysis, I discovered that late deliveries accounted for about 58% of total bookings. Surprisingly, although this company started its business in 2019, it received very few bookings until May 2020. As bookings increased, so did late deliveries.
Since late deliveries were linked to booking volume, I questioned whether the timing of bookings was an issue. Was the supplier at fault for these continuous delays? I was surprised to find that only 19% of suppliers handled 80% of the bookings, and 96% of shipments were processed within 24 hours.
Next, I analyzed the routes and distances, which led me to identify a vehicle management issue. About 90% of the vehicles were either underutilized or overutilized.
ZoomCharts visuals used




4U Report Challenges
Participate in data challenges, build and submit reports to get free template downloads.
Join CommunityMobile view allows you to interact with the report. To Download the template please switch to desktop view.
How to use a PBIX template
Preview the interactive report, download the PBIX file, open it in Power BI Desktop, and replace the same data connection with your own dataset.
Preview and download
Explore the report online and download the PBIX template file.
Open in Power BI Desktop
Open the downloaded PBIX file in Power BI Desktop.
Connect your data
Replace the sample data source with your own dataset.
Refresh and adjust
Refresh the model and update fields or visual were needed.
Save and share
Save your report and publish it for your audience.


