989
Fitness Membership Analytics 16
Fitness Membership Analytics 16
More Report pages
Report Author: John Ojeah
989
Share template with others
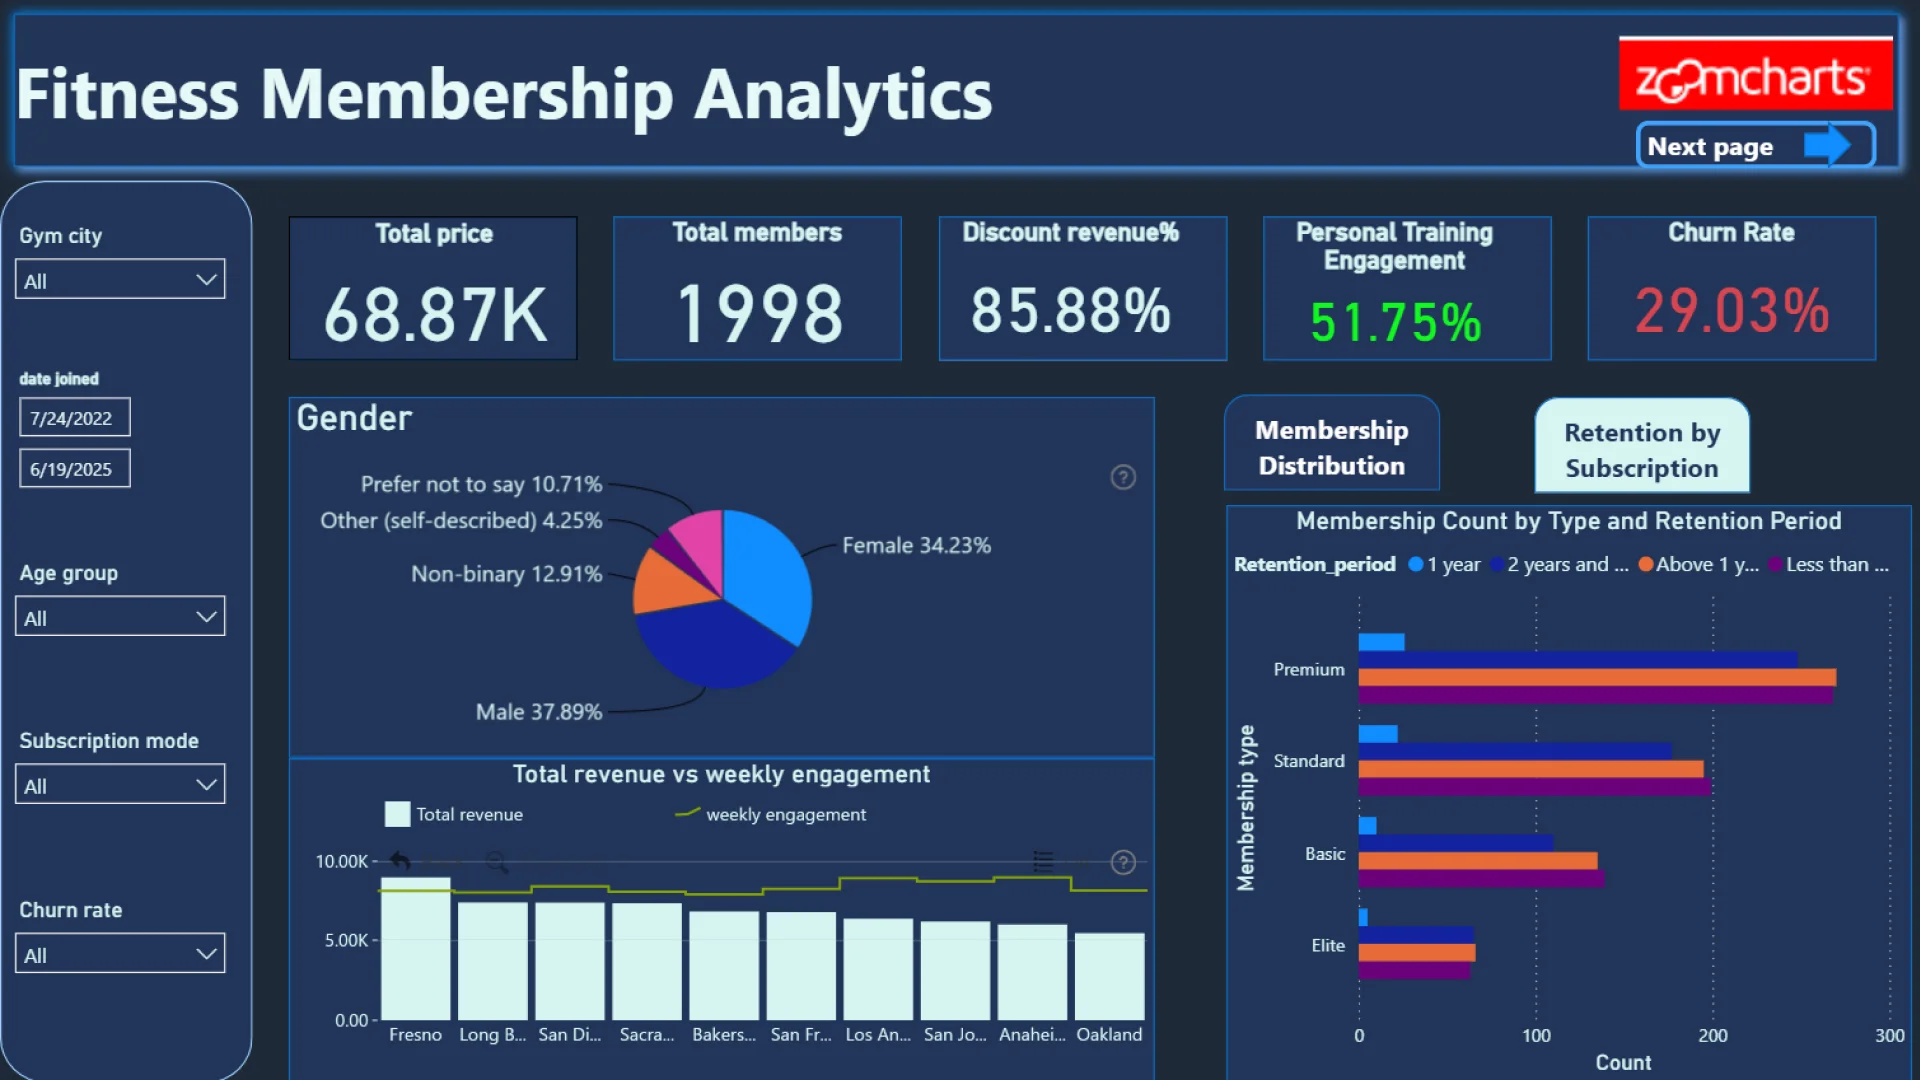
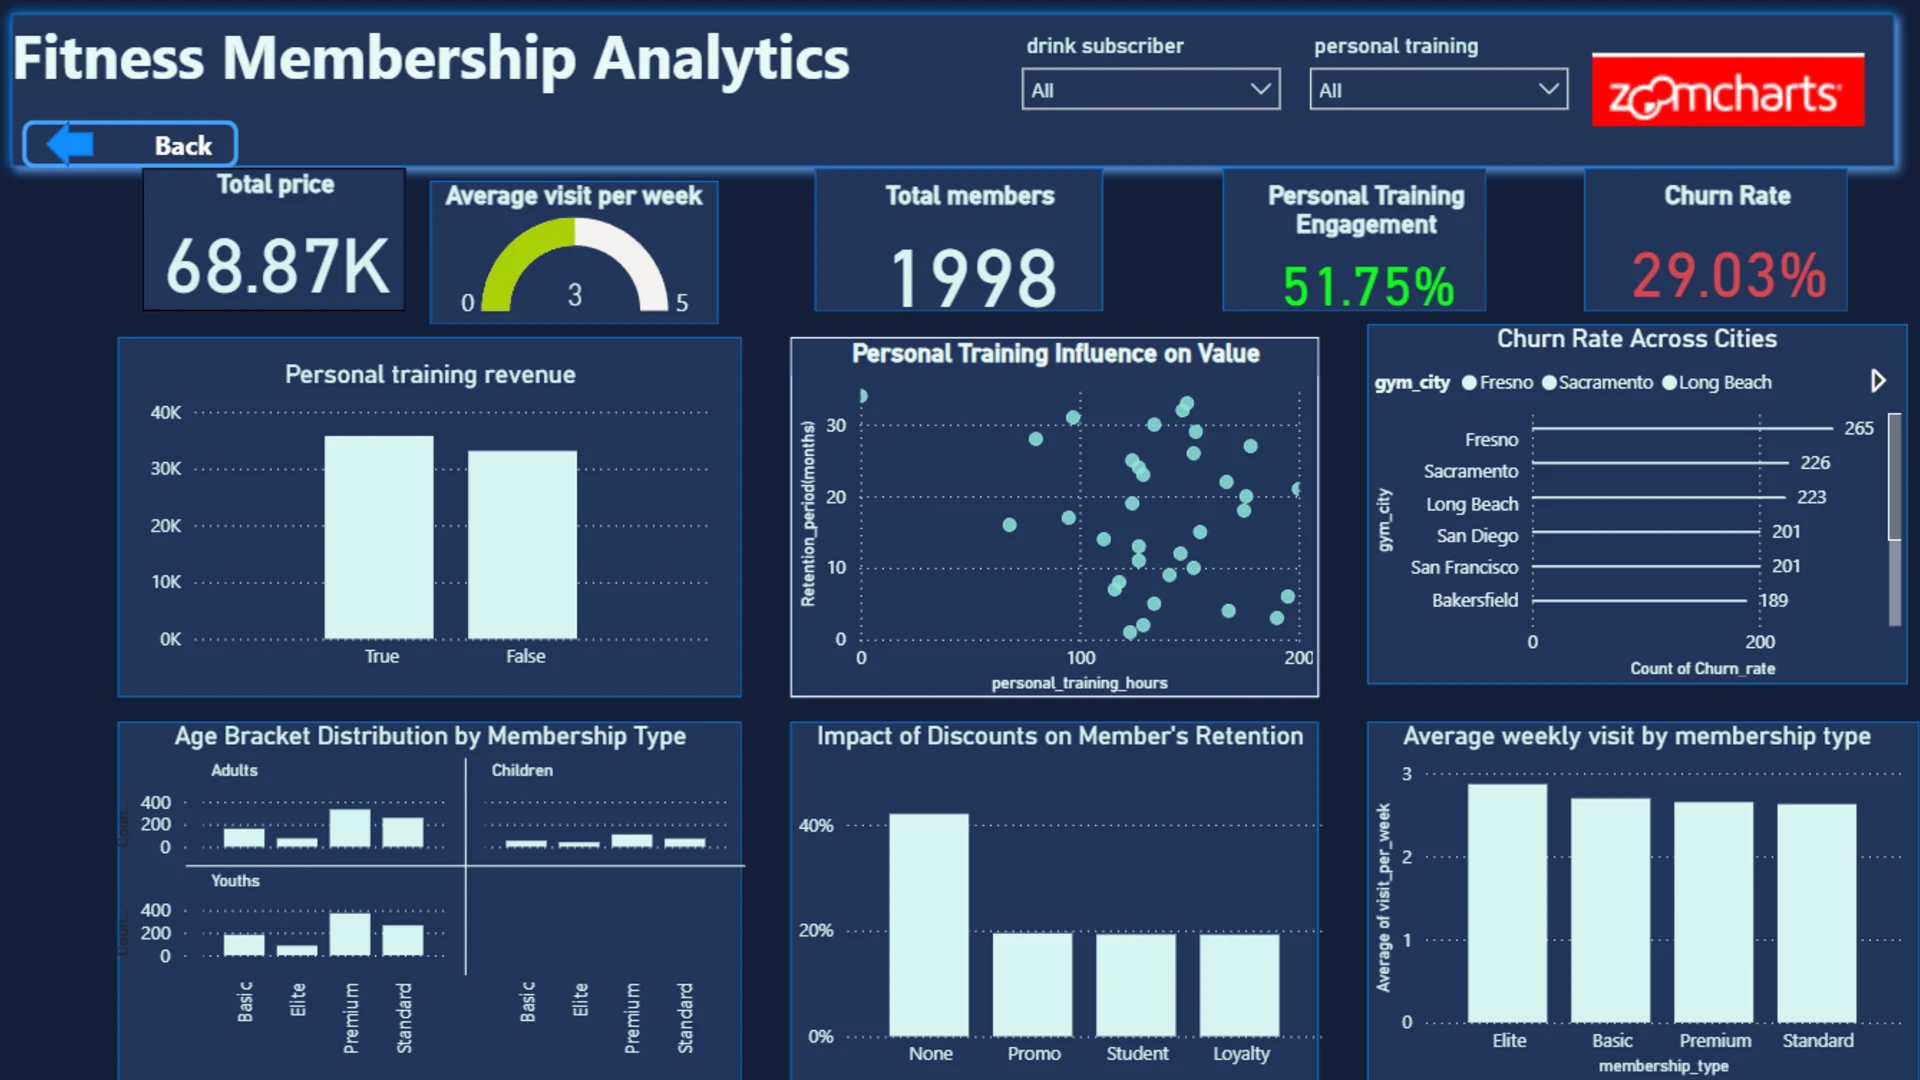
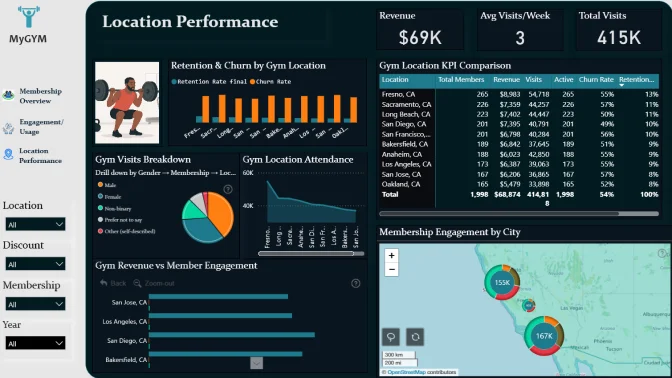
This Power BI report uses the Fitness Membership Dataset and features ZoomCharts Drill Down PRO custom visuals for Power BI. It was submitted to the Onyx Data DataDNA ZoomCharts Mini Challenge in August 2025.
Author's Description:
Delve into the MyGym fitness dashboard. The goal is to optimize retention, revenue, and engagement by understanding key member behaviors. Brief Summary of the Dashboard: My dashboard focuses on helping MyGym's business users make data-driven decisions. It features: Key Performance Indicators (KPIs) for a high-level overview. Interactive Slicers to filter the data by location, membership type, and other key dimensions. Key Insights, including the impact of personal training and group classes on member value, and an analysis of how discounts affect member retention.


4U Report Challenges
Participate in data challenges, build and submit reports to get free template downloads.
Join CommunityMobile view allows you to interact with the report. To Download the template please switch to desktop view.
How to use a PBIX template
Preview the interactive report, download the PBIX file, open it in Power BI Desktop, and replace the same data connection with your own dataset.
Preview and download
Explore the report online and download the PBIX template file.
Open in Power BI Desktop
Open the downloaded PBIX file in Power BI Desktop.
Connect your data
Replace the sample data source with your own dataset.
Refresh and adjust
Refresh the model and update fields or visual were needed.
Save and share
Save your report and publish it for your audience.


