1528
Fitness Membership Analysis
Fitness Membership Analysis
More Report pages
Report Author: Nina Ikpe
1528
Share template with others
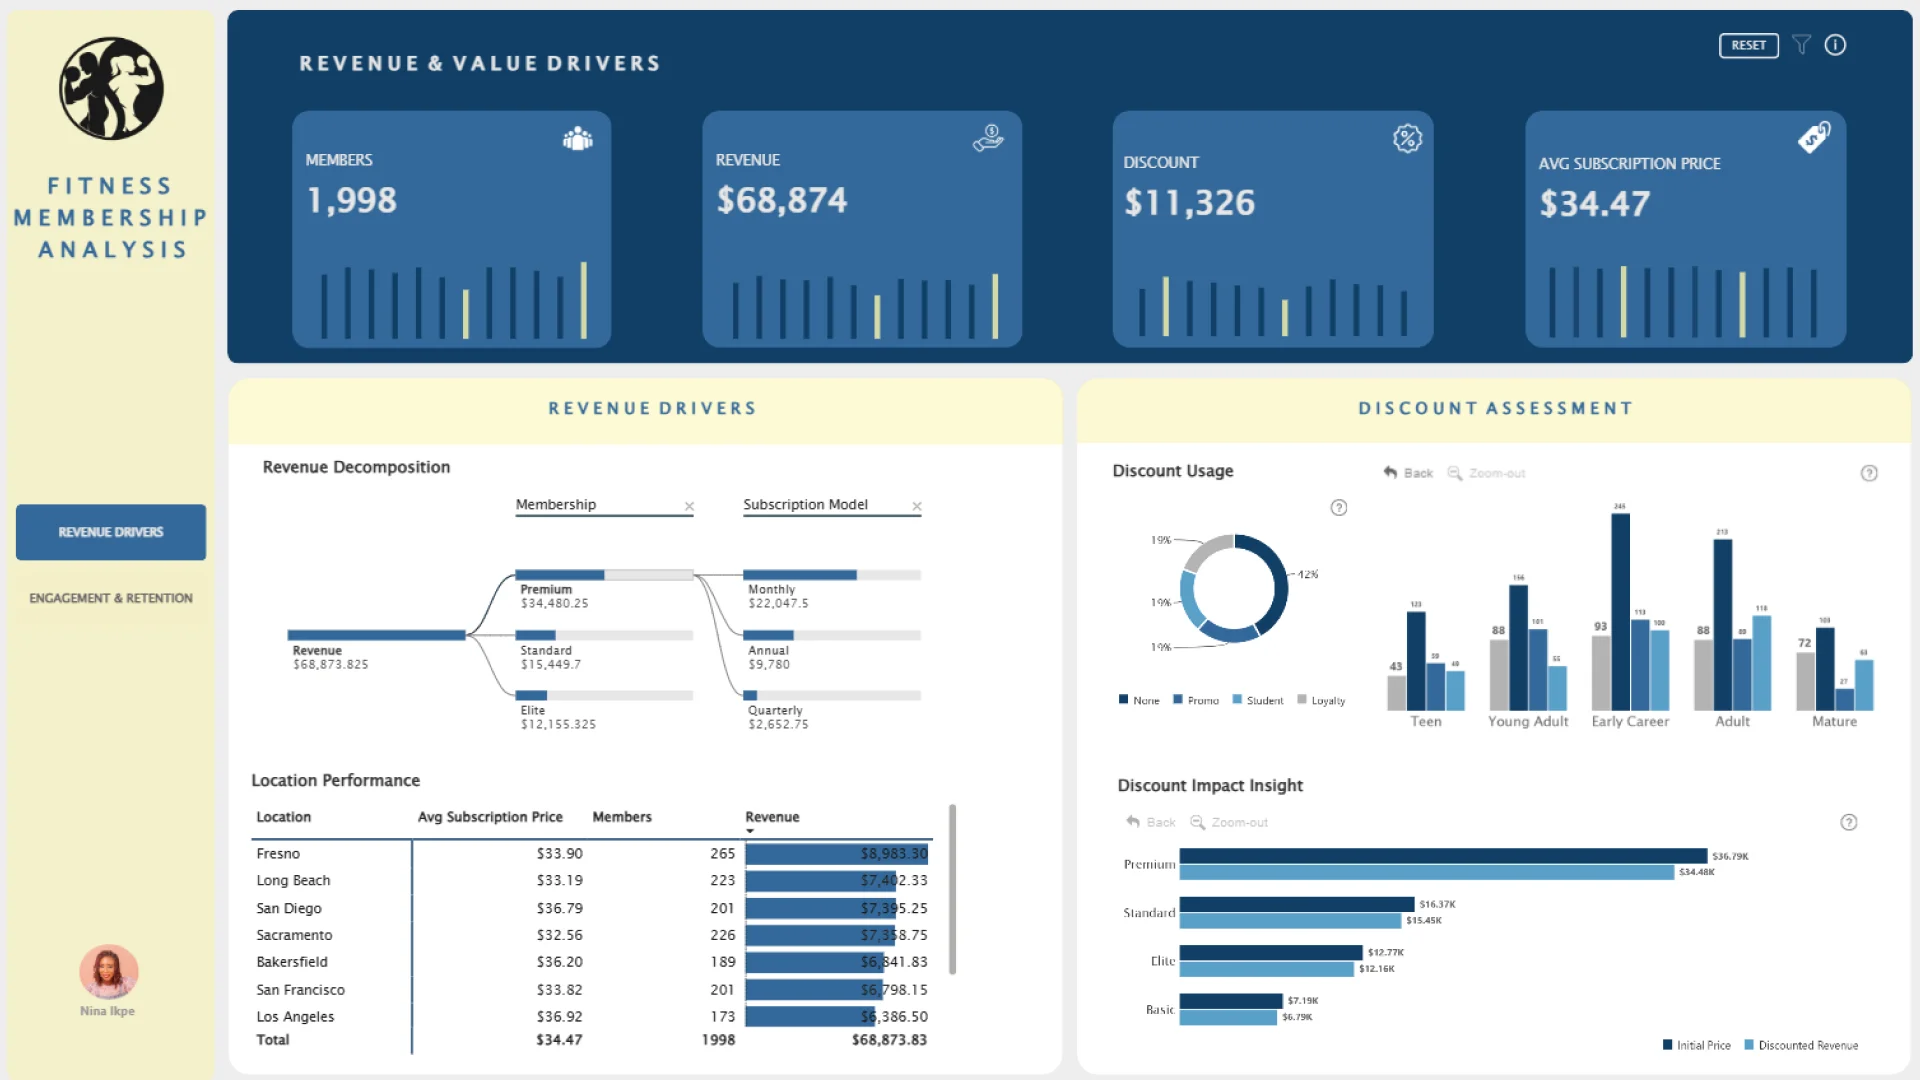
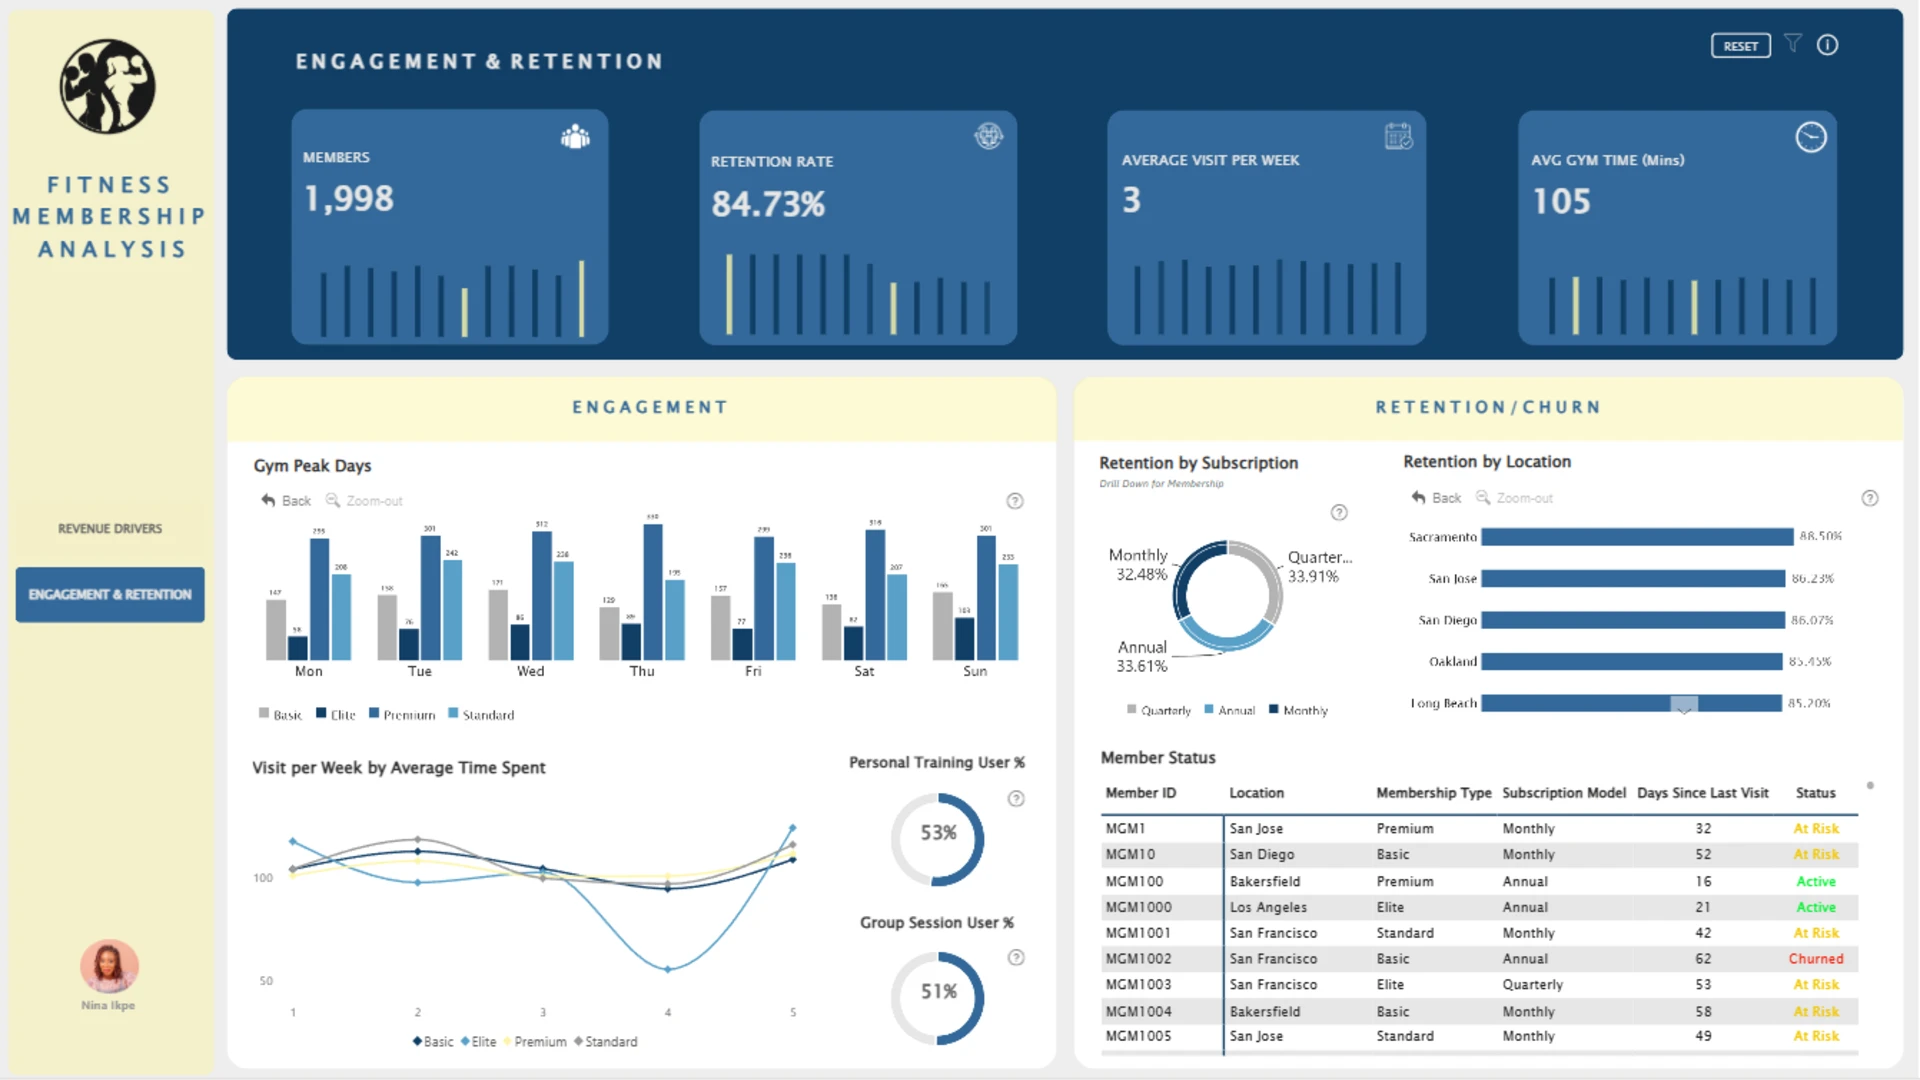
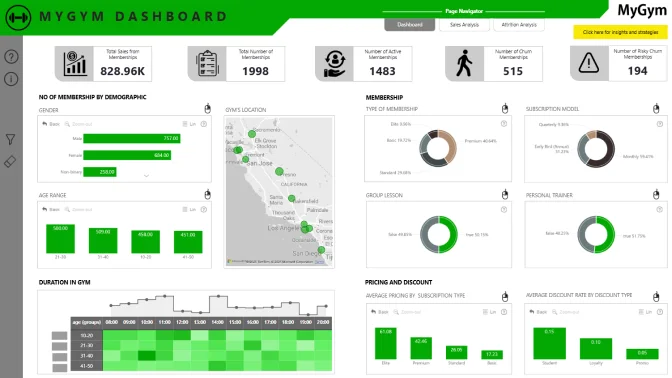
This Power BI report uses the Fitness Membership Dataset and features ZoomCharts Drill Down PRO custom visuals for Power BI. It was submitted to the Onyx Data DataDNA ZoomCharts Mini Challenge in August 2025.
Author's Description:
What drives satisfaction and loyalty to a fitness center? How do members engage with different services? Who are the main revenue and value drivers, and how much impact do discounts have on final revenue?
This Fitness Membership Report analyzes revenue/value drivers, engagement, and retention versus churn for MyGym. The first page presents insights on revenue drivers and discount assessment—who brings the most value, where revenue comes from, and how discounts affect it. The second page focuses on membership engagement and retention, showing who stays loyal, who churns, who is at risk, and how members use different services.



4U Report Challenges
Participate in data challenges, build and submit reports to get free template downloads.
Join CommunityMobile view allows you to interact with the report. To Download the template please switch to desktop view.
How to use a PBIX template
Preview the interactive report, download the PBIX file, open it in Power BI Desktop, and replace the same data connection with your own dataset.
Preview and download
Explore the report online and download the PBIX template file.
Open in Power BI Desktop
Open the downloaded PBIX file in Power BI Desktop.
Connect your data
Replace the sample data source with your own dataset.
Refresh and adjust
Refresh the model and update fields or visual were needed.
Save and share
Save your report and publish it for your audience.


