1769
Fitness Company Finance Analysis 2
Fitness Company Finance Analysis 2
More Report pages
Report Author: Dileep Venkata Prasad Bocha
1769
Share template with others
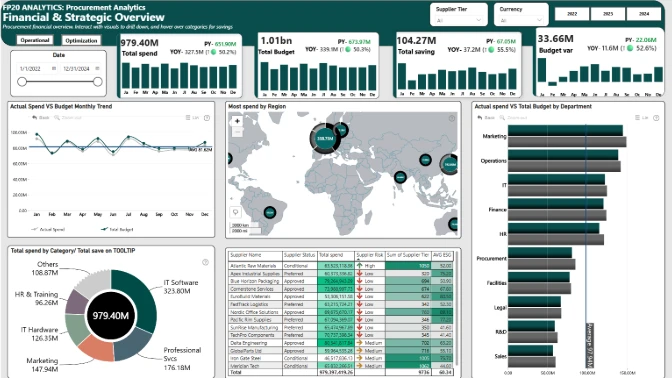
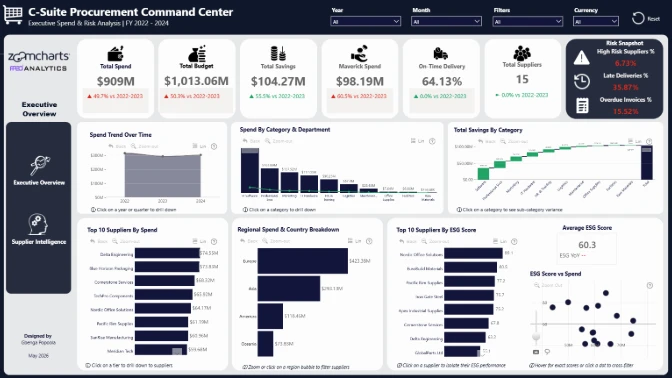
Report submitted for Onyx Data DataDNA ZoomCharts Mini Challenge, August 2024. The report was built based on Fitness Company Finance Dataset and includes ZoomCharts custom Drill Down PRO visuals for Power BI.
Author's description:
Here’s an overview of my 3-page analysis:
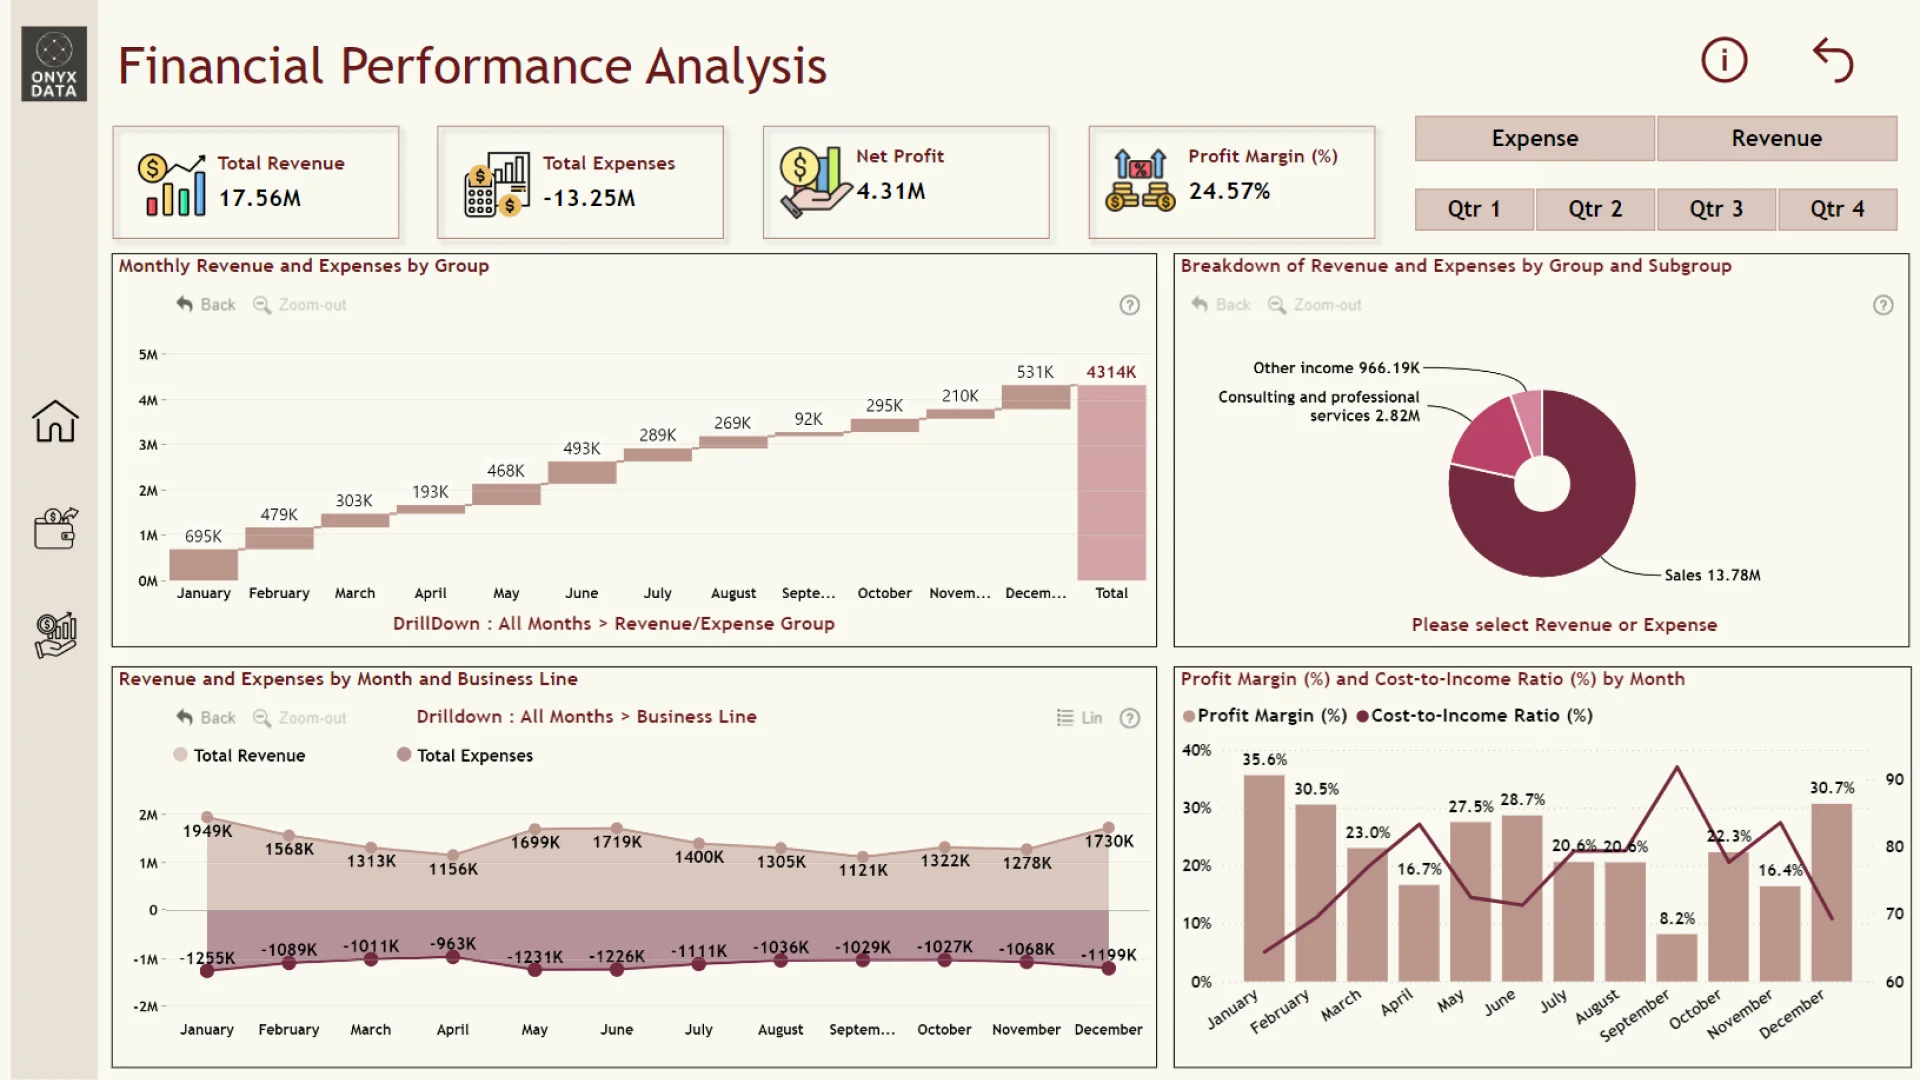
Page 1: Financial Performance Overview
Visualizes key financial metrics such as revenue, expenses, and profit margin to assess overall business performance.
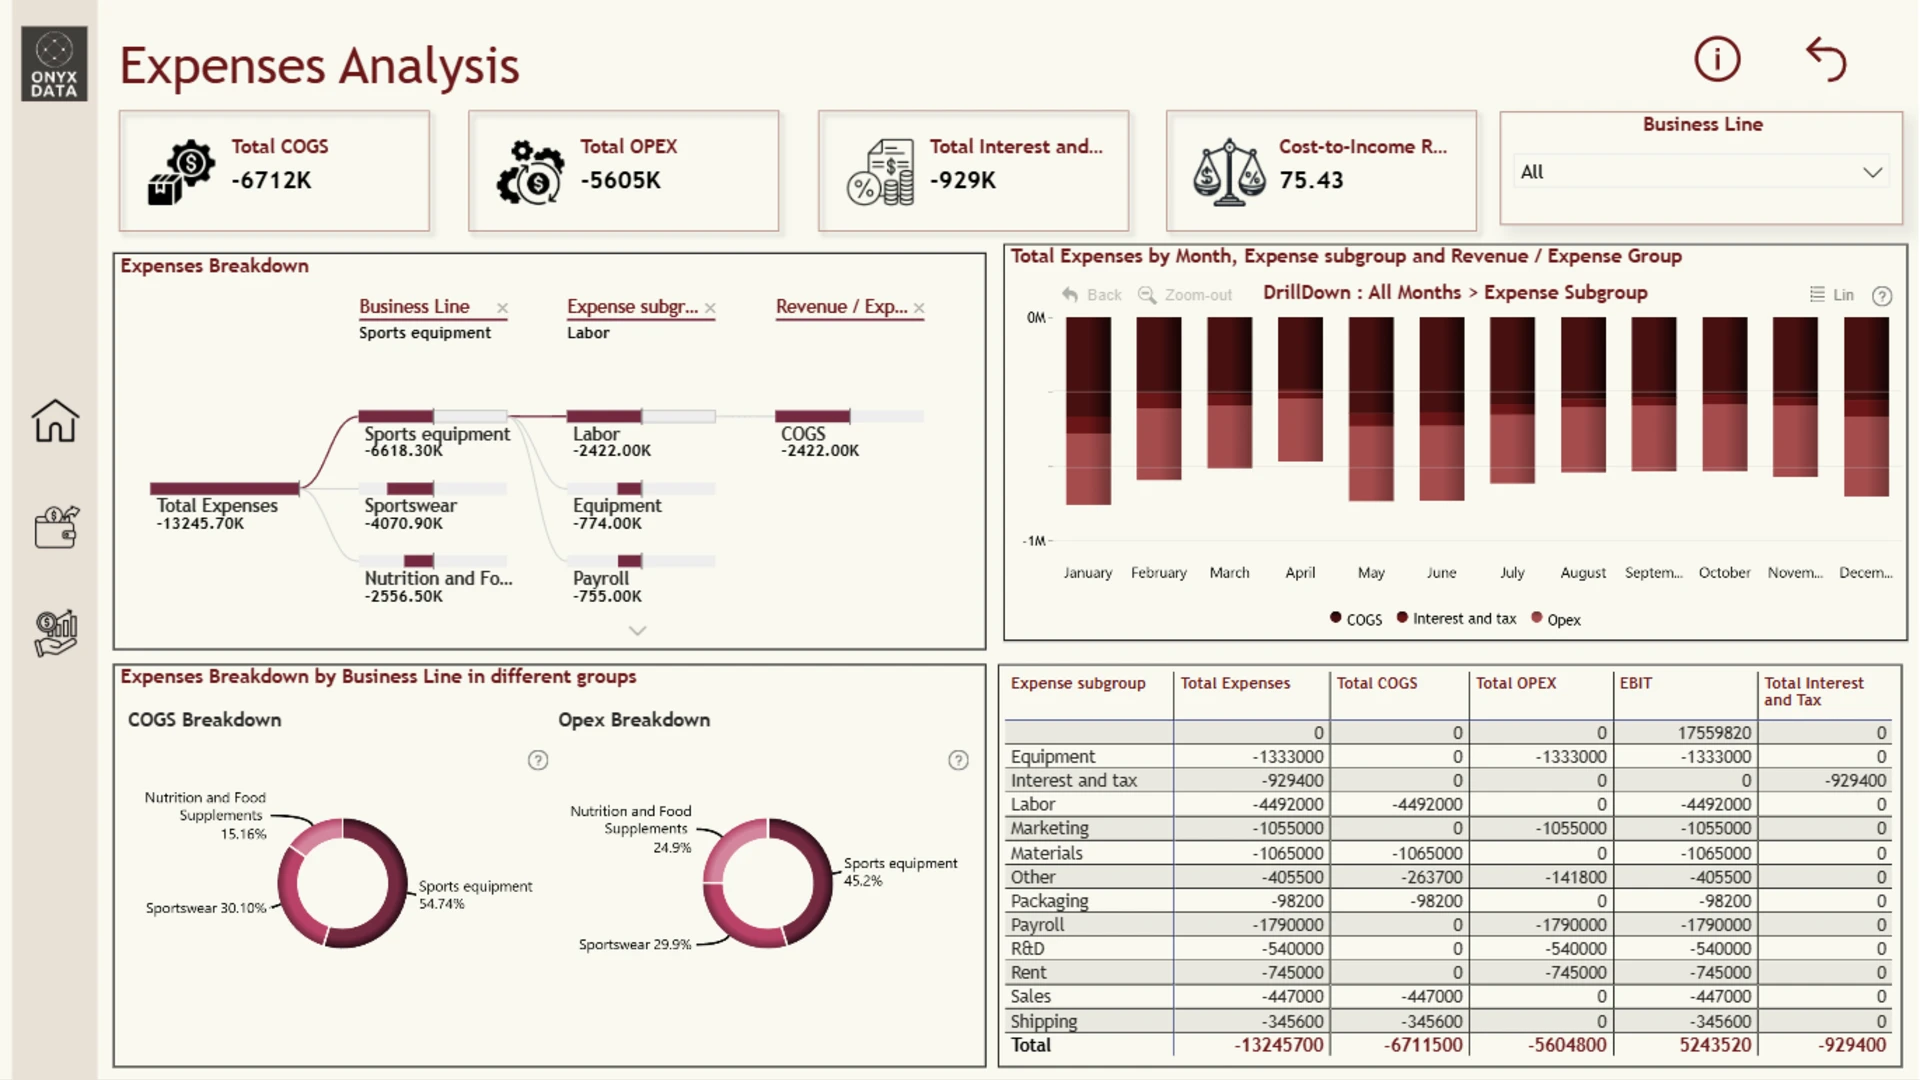
Page 2: Expense Analysis
Breaks down expenses by business line, subgroups, and categories, aiding in cost management optimization.
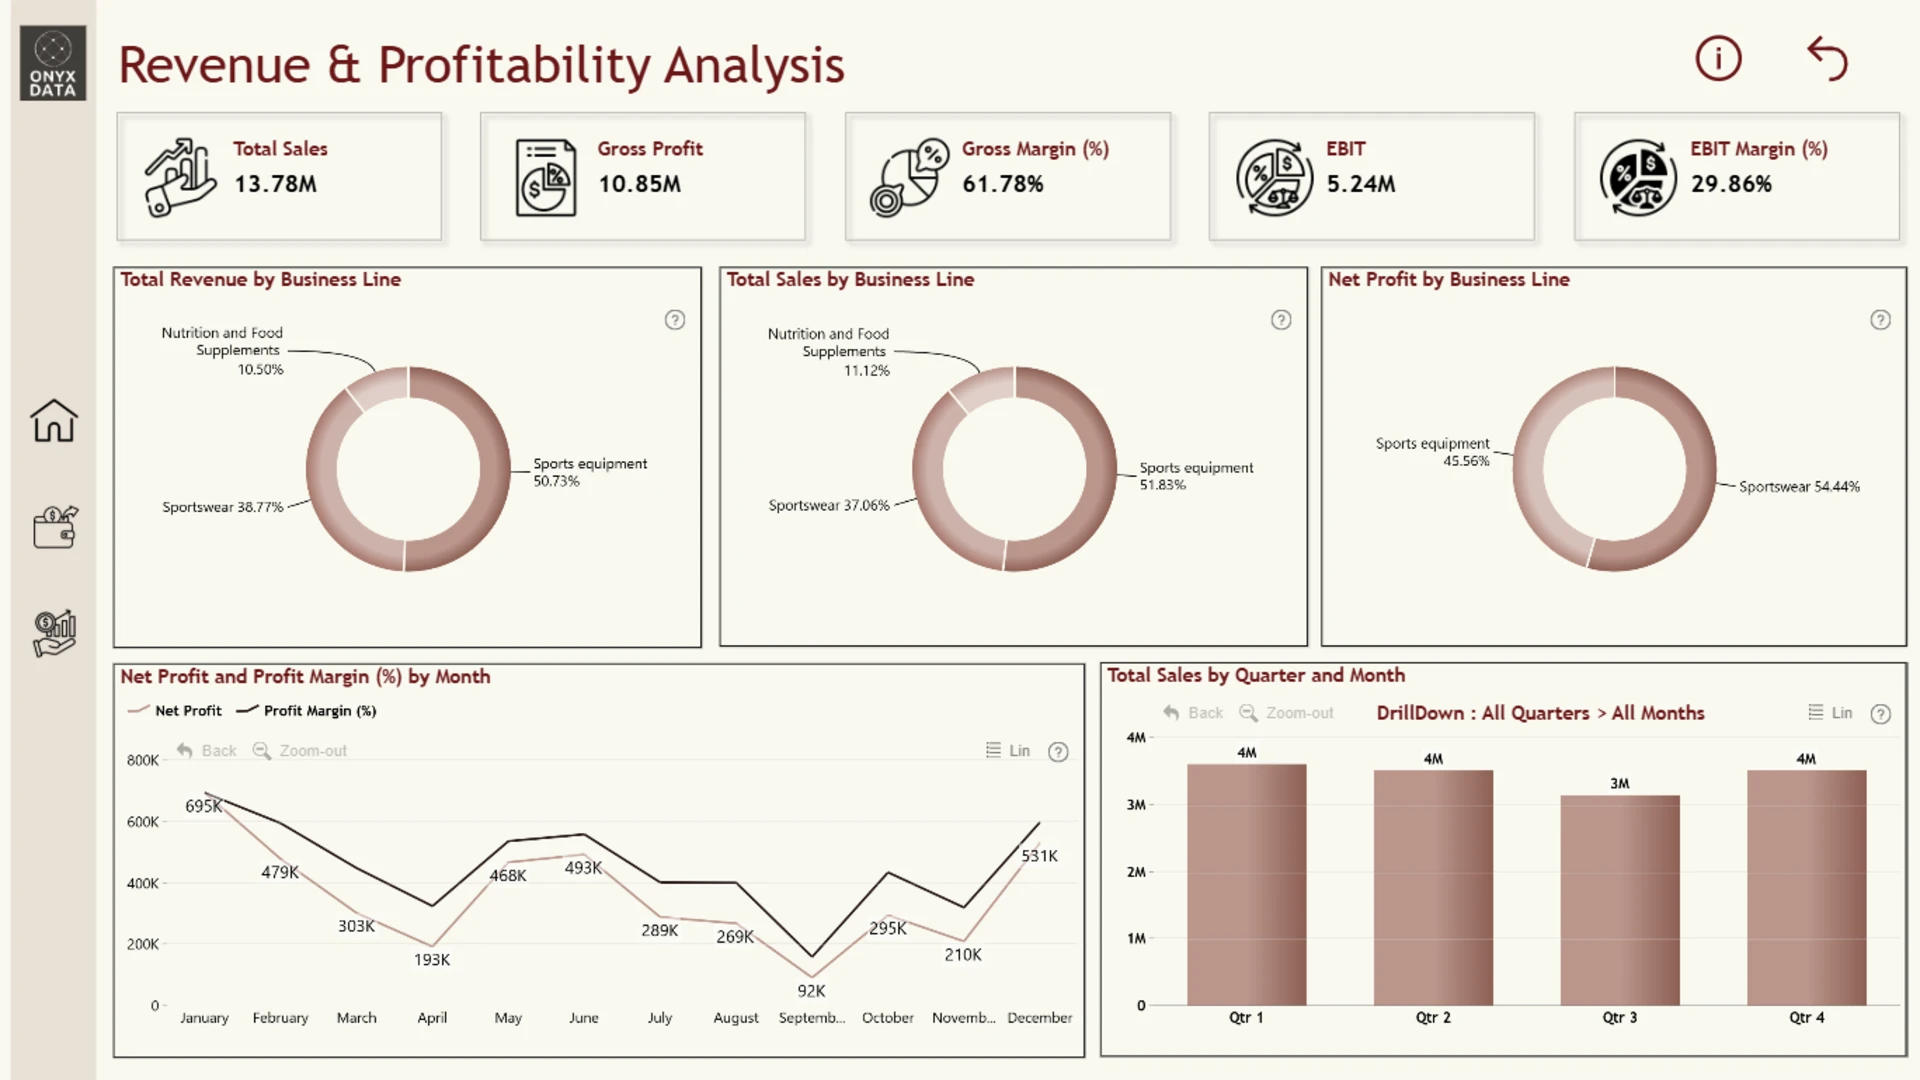
Page 3: Revenue and Profitability Analysis
Analyzes sales, profit, and margins by business line, month, and quarter to inform revenue growth strategies.
4U Report Challenges
Participate in data challenges, build and submit reports to get free template downloads.
Join CommunityMobile view allows you to interact with the report. To Download the template please switch to desktop view.
Was this helpful? Thank you for your feedback!
Sorry about that.
How can we improve it?