965
Fitness Company Finance Analysis 17
Fitness Company Finance Analysis 17
Report Author: Jesse Ekanem
965
Share template with others
Report submitted for Onyx Data DataDNA ZoomCharts Mini Challenge, August 2024. The report was built based on Fitness Company Finance Dataset and includes ZoomCharts custom Drill Down PRO visuals for Power BI.
Author's description:
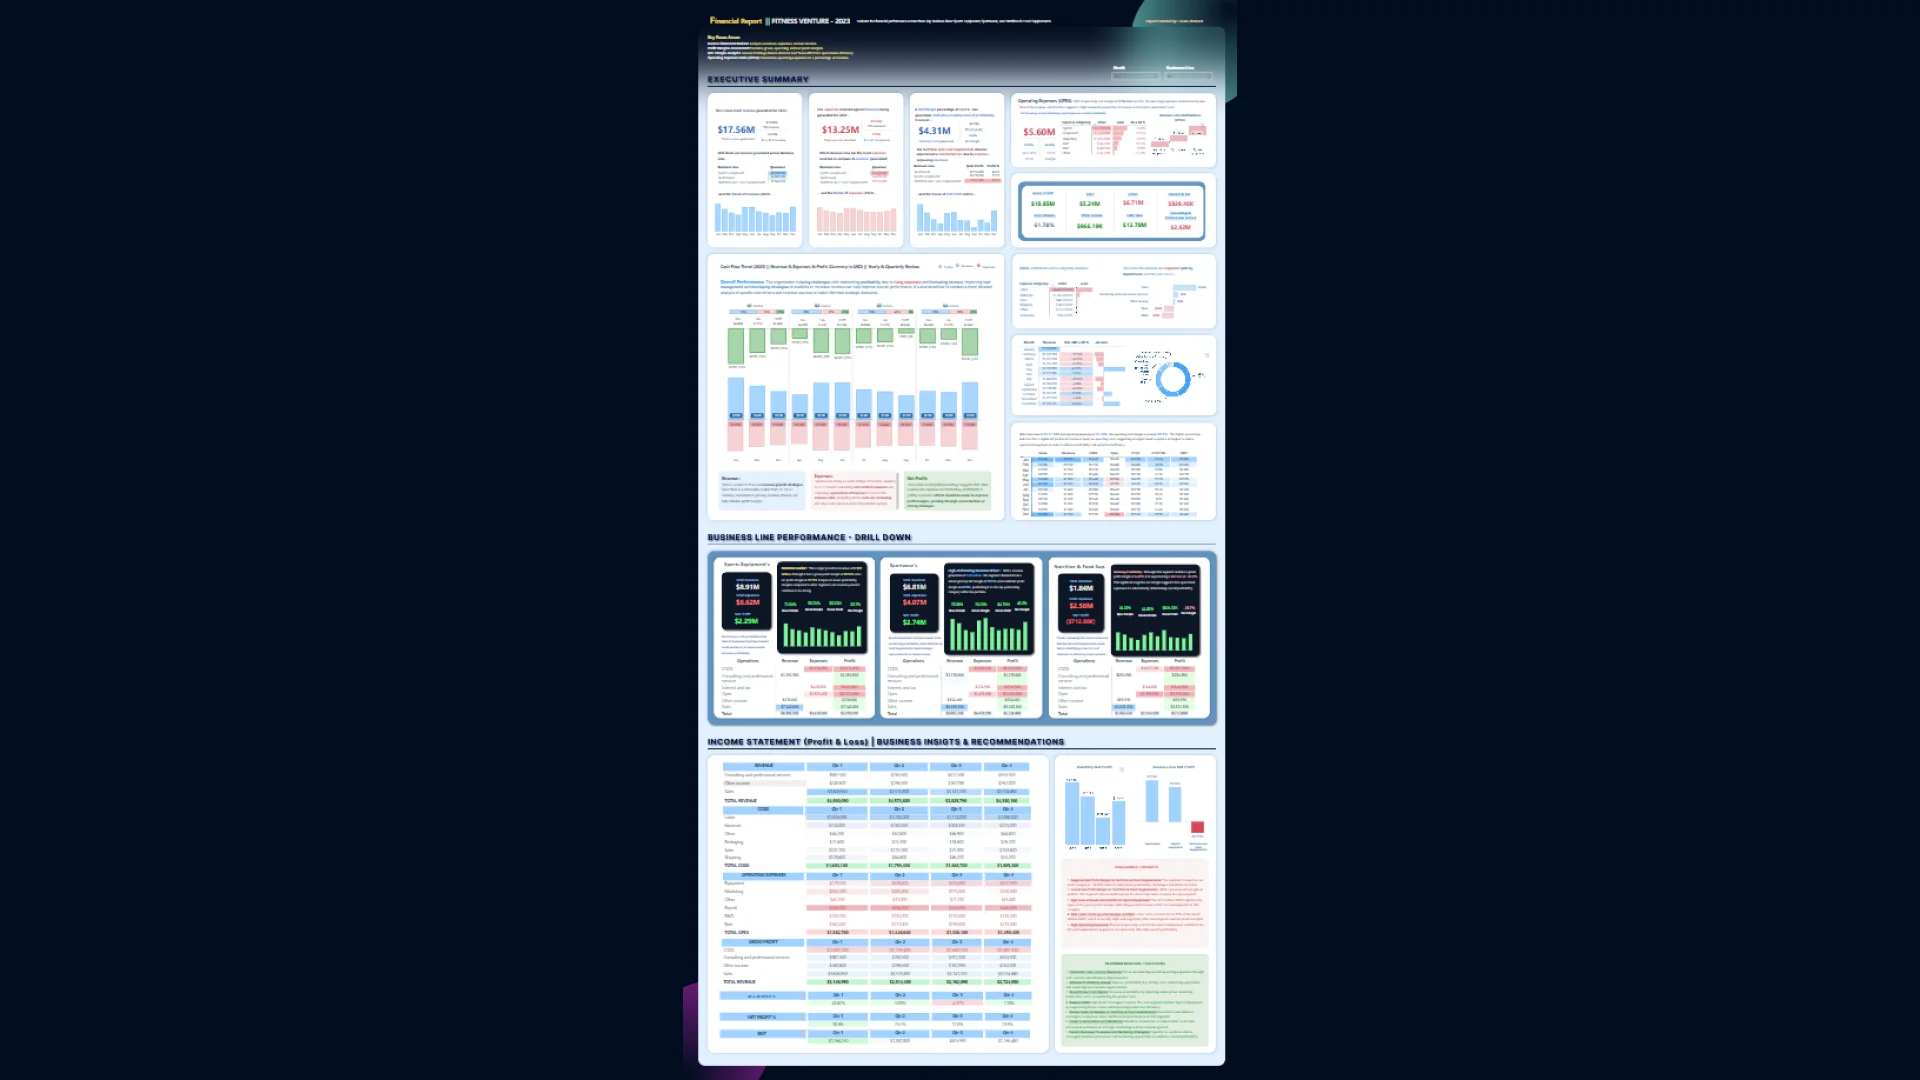
This report provides a comprehensive analysis of the company's financial performance, focusing on revenue, expenses, and profitability.
Revenue Performance:
Total revenue for the year is $17.56M, with a gross profit of $14.74M. The sports equipment line shows strong revenue generation, while the nutrition and food supplements line lags behind.
Cost Management:
Total COGS amounts to $2.82M, indicating a need to monitor and potentially optimize these costs further. Total OPEX is $5.60M, which significantly impacts net profit margins.
Profitability:
Net profit for the year is $5.6M, with a gross profit margin of 83.95% and a net profit margin of 31.89%. These metrics indicate strong profitability, though there is room for improvement by focusing on cost reductions.
Seasonal Trends:
Quarterly and monthly analysis reveals fluctuations in revenue and expenses, suggesting the presence of seasonal trends that require strategic planning.


4U Report Challenges
Participate in data challenges, build and submit reports to get free template downloads.
Join CommunityMobile view allows you to interact with the report. To Download the template please switch to desktop view.
How to use a PBIX template
Preview the interactive report, download the PBIX file, open it in Power BI Desktop, and replace the same data connection with your own dataset.
Preview and download
Explore the report online and download the PBIX template file.
Open in Power BI Desktop
Open the downloaded PBIX file in Power BI Desktop.
Connect your data
Replace the sample data source with your own dataset.
Refresh and adjust
Refresh the model and update fields or visual were needed.
Save and share
Save your report and publish it for your audience.


