865
Fitness Company Finance Analysis 11
Fitness Company Finance Analysis 11
Report Author: Rami Kassiar
865
Share template with others
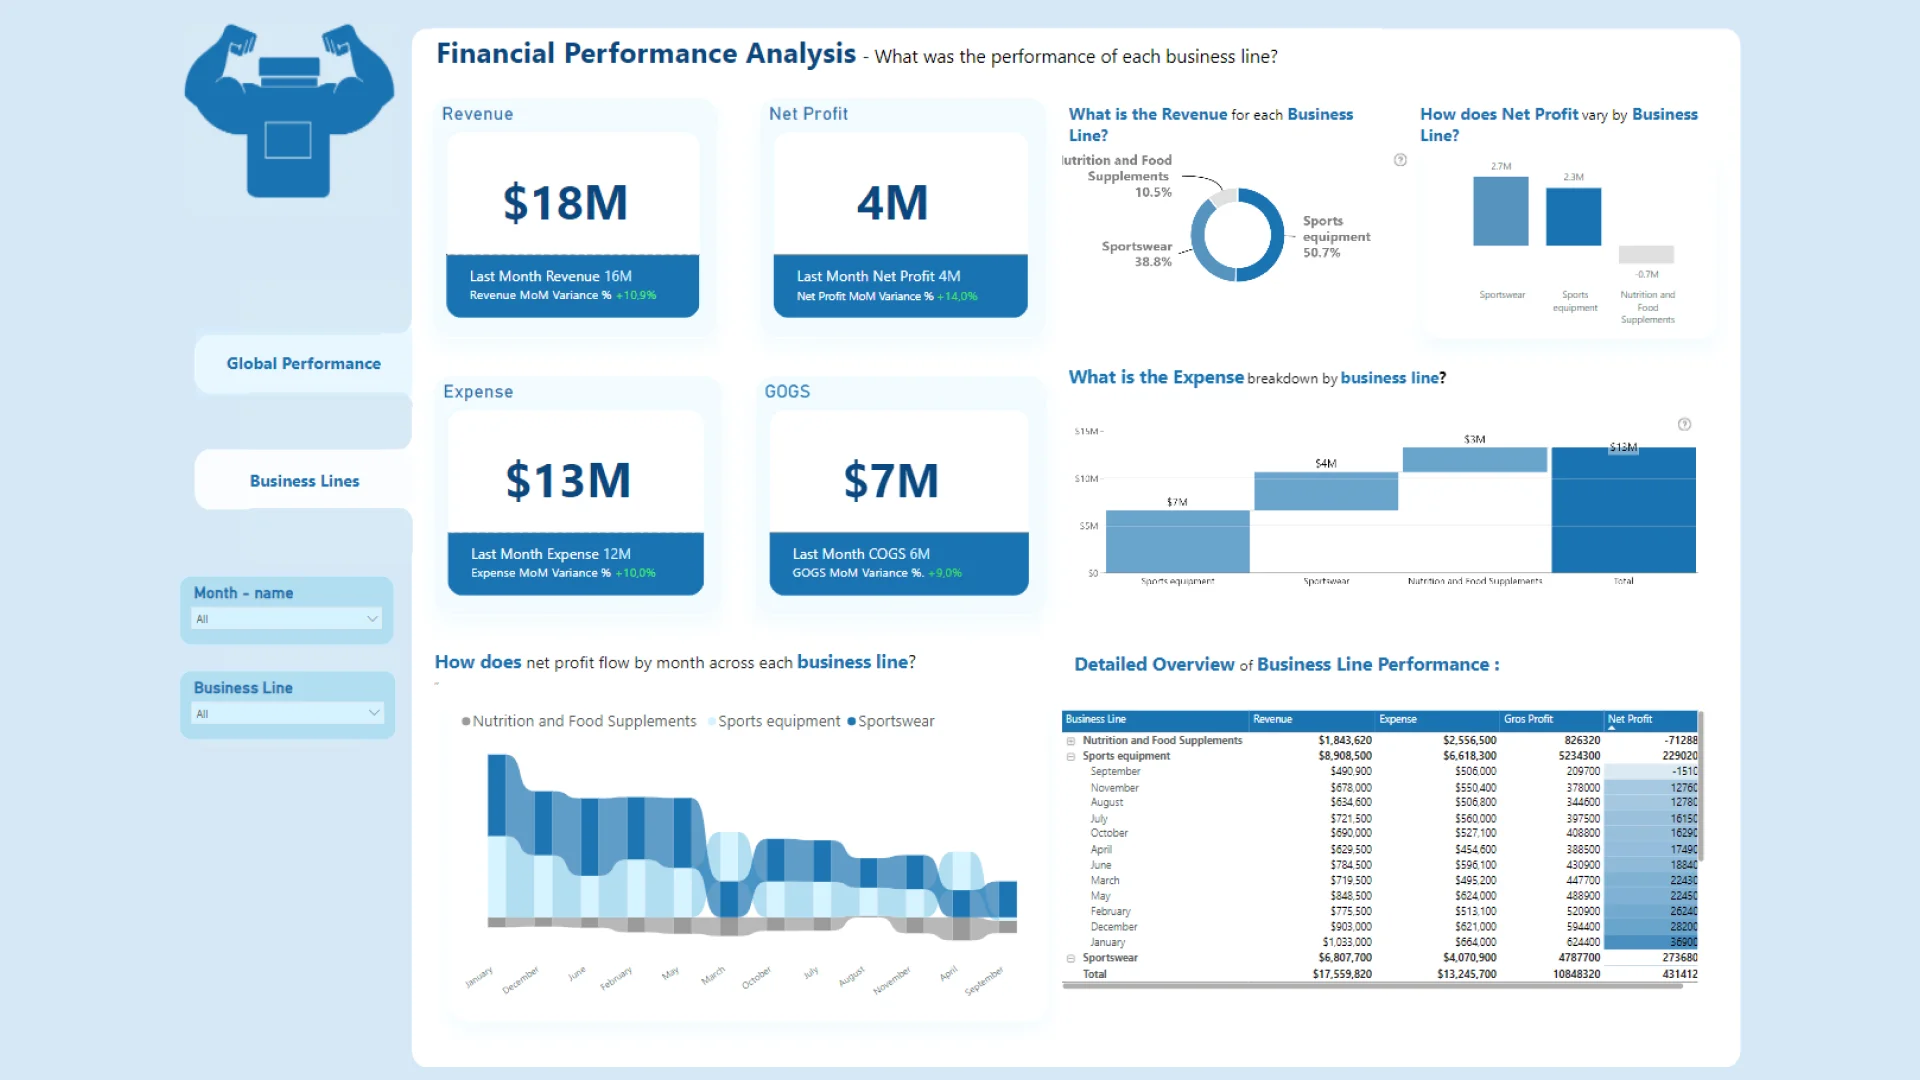
Report submitted for Onyx Data DataDNA ZoomCharts Mini Challenge, August 2024. The report was built based on Fitness Company Finance Dataset and includes ZoomCharts custom Drill Down PRO visuals for Power BI.
Author's description:
Step 1: Data Understanding
The first step was to dive into the dataset, which includes financial information for a company specializing in sportswear, nutrition, and sports equipment. I thoroughly examined the data, analyzing its structure, including the number of columns and rows, to gain a clear understanding of what I was working with.
Step 2: Building the Star Schema Model
Next, I developed a star schema model to organize the data efficiently. This involved separating quantitative data into a fact table and creating dimension tables for various entities. This approach ensures the data is structured in a way that supports effective analysis.
Step 3: Defining Key Performance Indicators (KPIs)
I then defined six critical KPIs to measure the performance of the business lines. These KPIs include Revenue, Expenses, Gross Profit, Net Profit, EBIT, and COGS. These metrics provide a comprehensive overview of the company’s financial health and operational efficiency.
Step 4: Dashboard Design
Finally, I focused on designing the dashboard. I used PowerPoint to create a visually appealing background for the report.


4U Report Challenges
Participate in data challenges, build and submit reports to get free template downloads.
Join CommunityMobile view allows you to interact with the report. To Download the template please switch to desktop view.
How to use a PBIX template
Preview the interactive report, download the PBIX file, open it in Power BI Desktop, and replace the same data connection with your own dataset.
Preview and download
Explore the report online and download the PBIX template file.
Open in Power BI Desktop
Open the downloaded PBIX file in Power BI Desktop.
Connect your data
Replace the sample data source with your own dataset.
Refresh and adjust
Refresh the model and update fields or visual were needed.
Save and share
Save your report and publish it for your audience.


