1308
Enterprise Data Governance Power BI Report 5
Enterprise Data Governance Power BI Report 5
More Report pages
Report Author: Muhammad Saleem
1308
Share template with others
This Power BI report is built using the Enterprise Data Governance Dataset and features ZoomCharts Drill Down PRO custom visuals for Power BI. It was submitted to the FP20 Analytics ZoomCharts Data Challenge #34 (January 2026 – February 2026).
Author's Description:
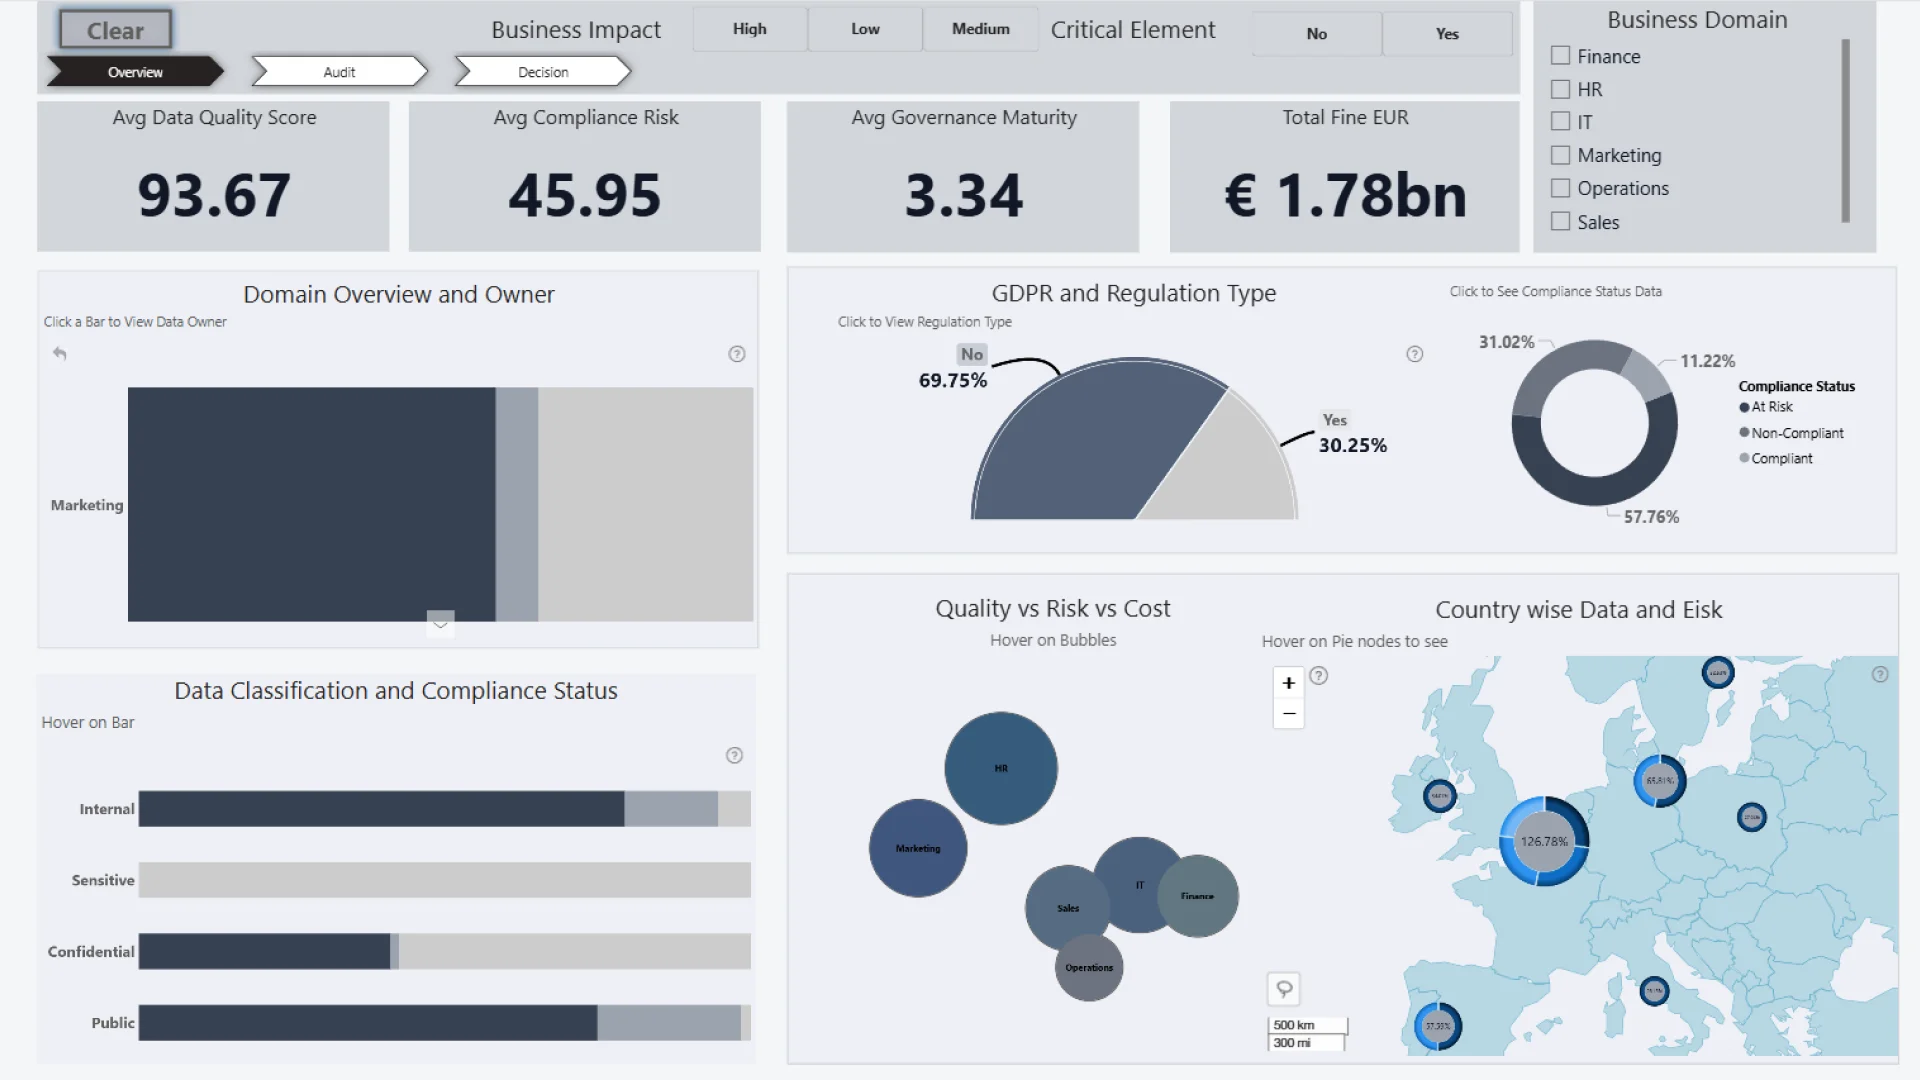
Page 1: Overview Dashboard The Overview Dashboard provides a concise view of governance, combining data quality, compliance risk, maturity, and geographic exposure. Data quality stands at 93.67, with moderate compliance risk of 45.95, governance maturity of 3.34/5, and €1.78bn in fines indicating regulatory exposure. This page helps leaders benchmark maturity, identify compliance gaps, and prioritise remediation.
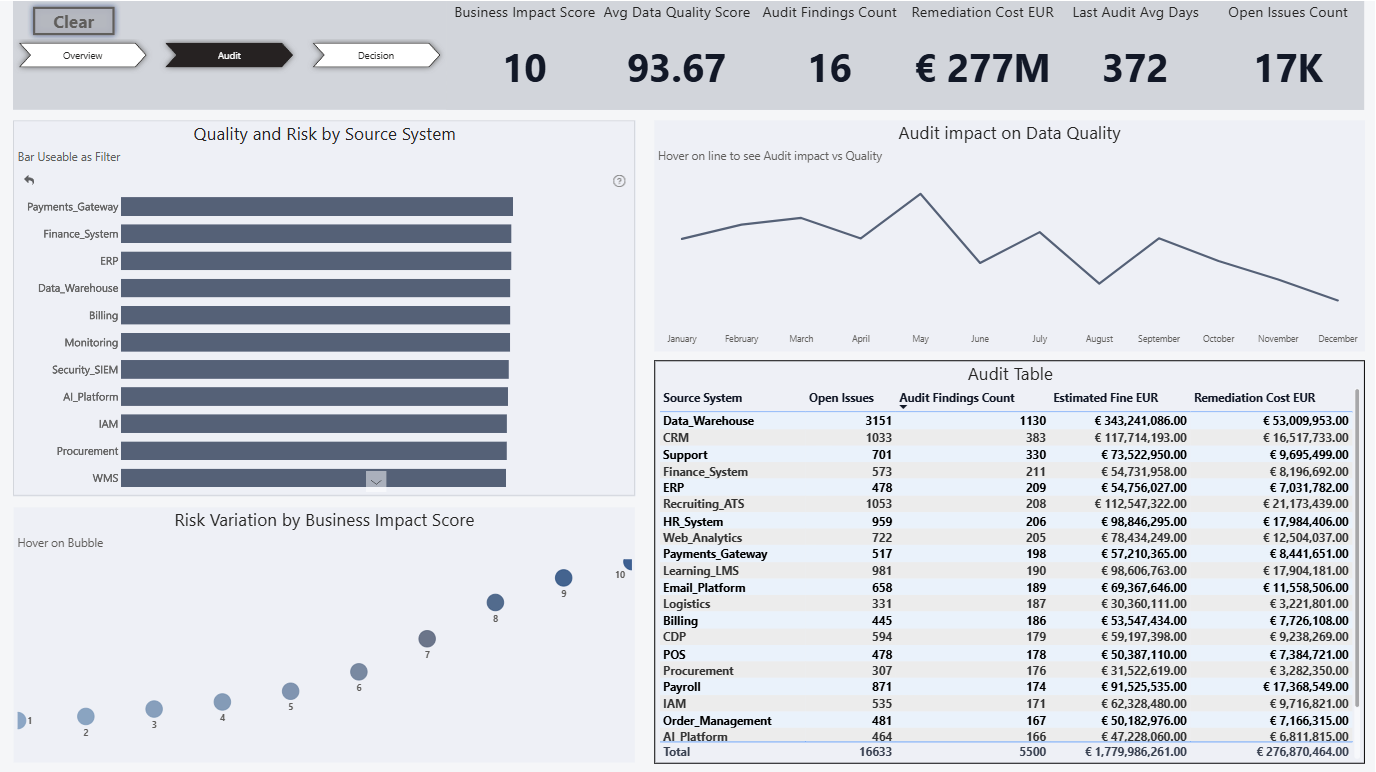
Page 2: Audit Dashboard The Audit Dashboard tracks audit findings, remediation costs, and data quality impact across source systems. It reports a business impact score of 10, 17K open issues, 2,560 findings, and €66M in remediation costs, highlighting systemic weaknesses and enabling quantification of audit-driven risk and costs.
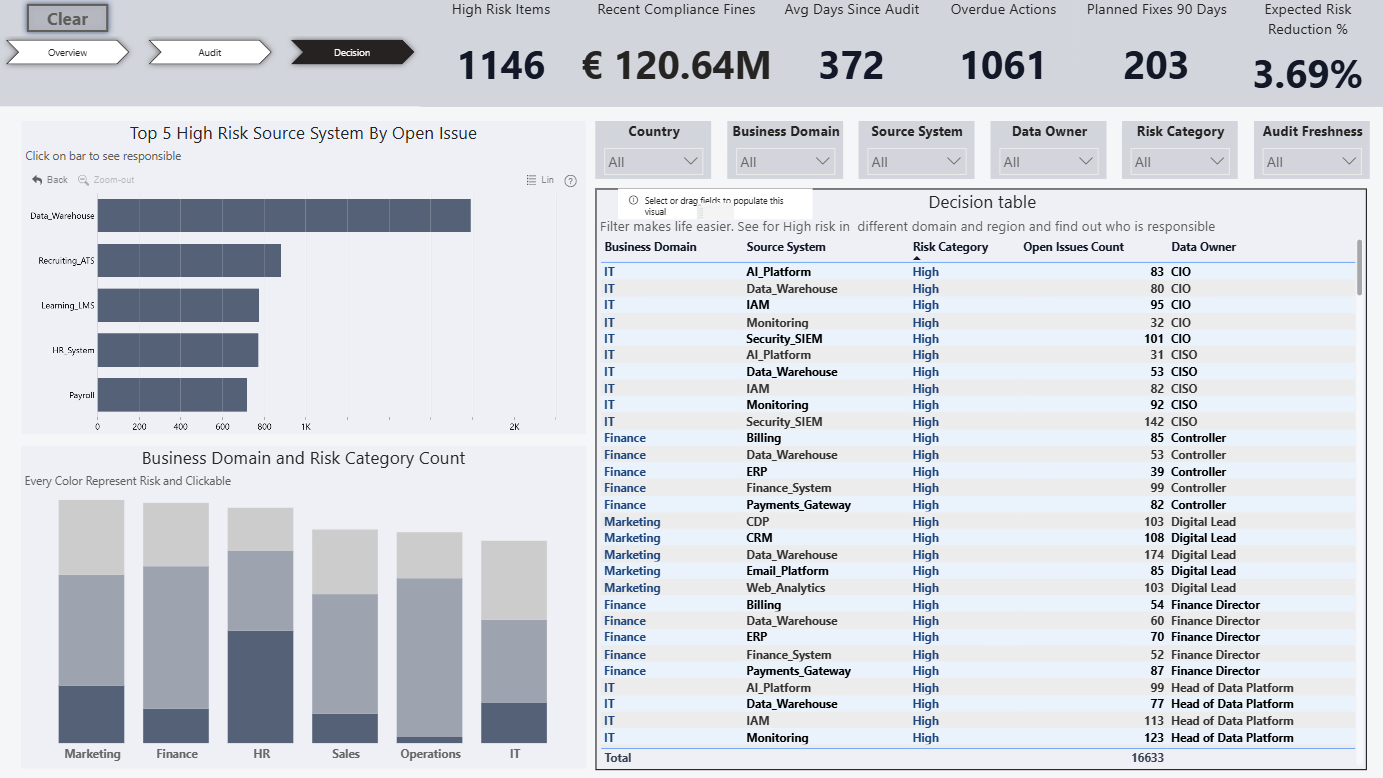
Page 3: Decision Dashboard The Decision Dashboard supports risk and compliance decision-making across domains. Key metrics include 1,146 high-risk items, €120.64M in fines, 372 days since the last audit, 1,061 overdue actions, and 16,821 open issues, providing clear visibility into risk, ownership, and overdue remediation.
ZoomCharts visuals used




4U Report Challenges
Participate in data challenges, build and submit reports to get free template downloads.
Join CommunityMobile view allows you to interact with the report. To Download the template please switch to desktop view.



How to use a PBIX template
Preview the interactive report, download the PBIX file, open it in Power BI Desktop, and replace the same data connection with your own dataset.
Preview and download
Explore the report online and download the PBIX template file.
Open in Power BI Desktop
Open the downloaded PBIX file in Power BI Desktop.
Connect your data
Replace the sample data source with your own dataset.
Refresh and adjust
Refresh the model and update fields or visual were needed.
Save and share
Save your report and publish it for your audience.


