1072
Employee Performance and Productivity Analysis – DataDNA Dataset Challenge
Employee Performance and Productivity Analysis – DataDNA Dataset Challenge
More Report pages
Report Author: Nogho Tidang Belviane
1072
Share template with others
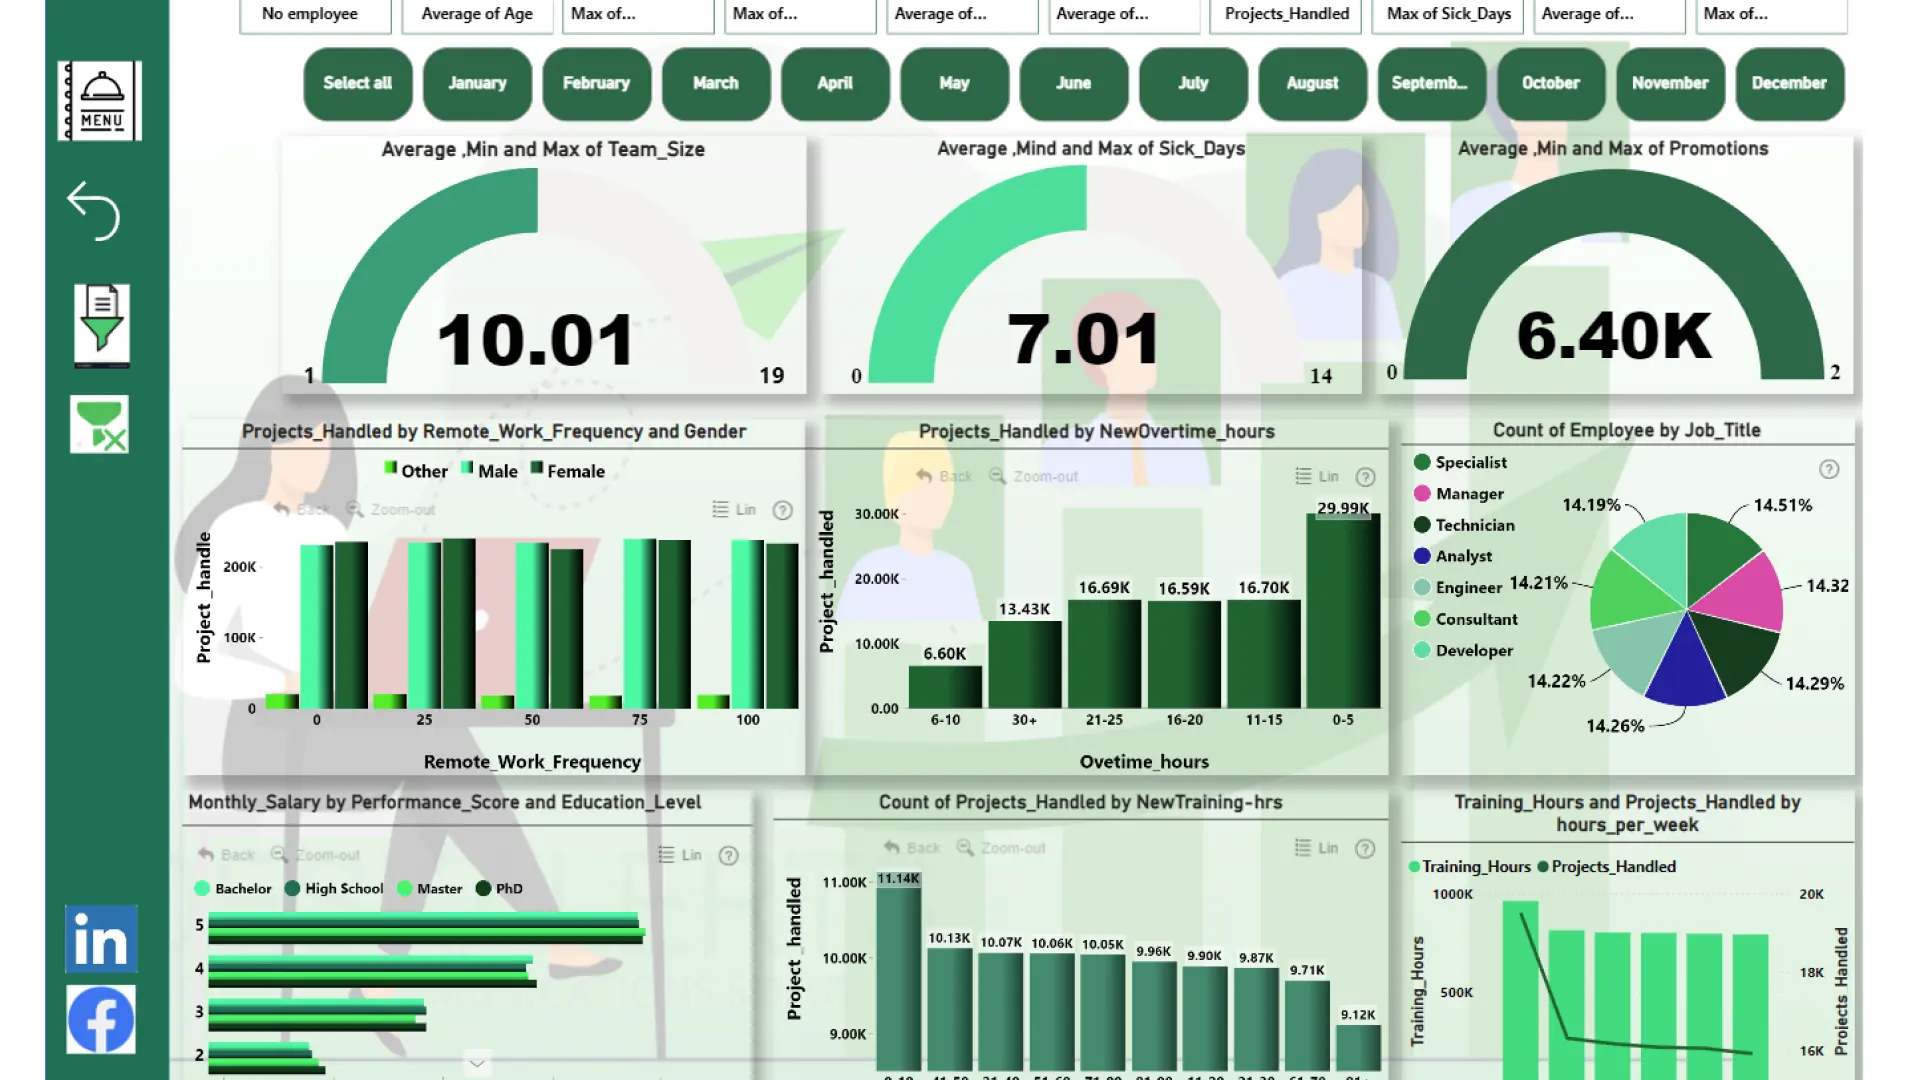
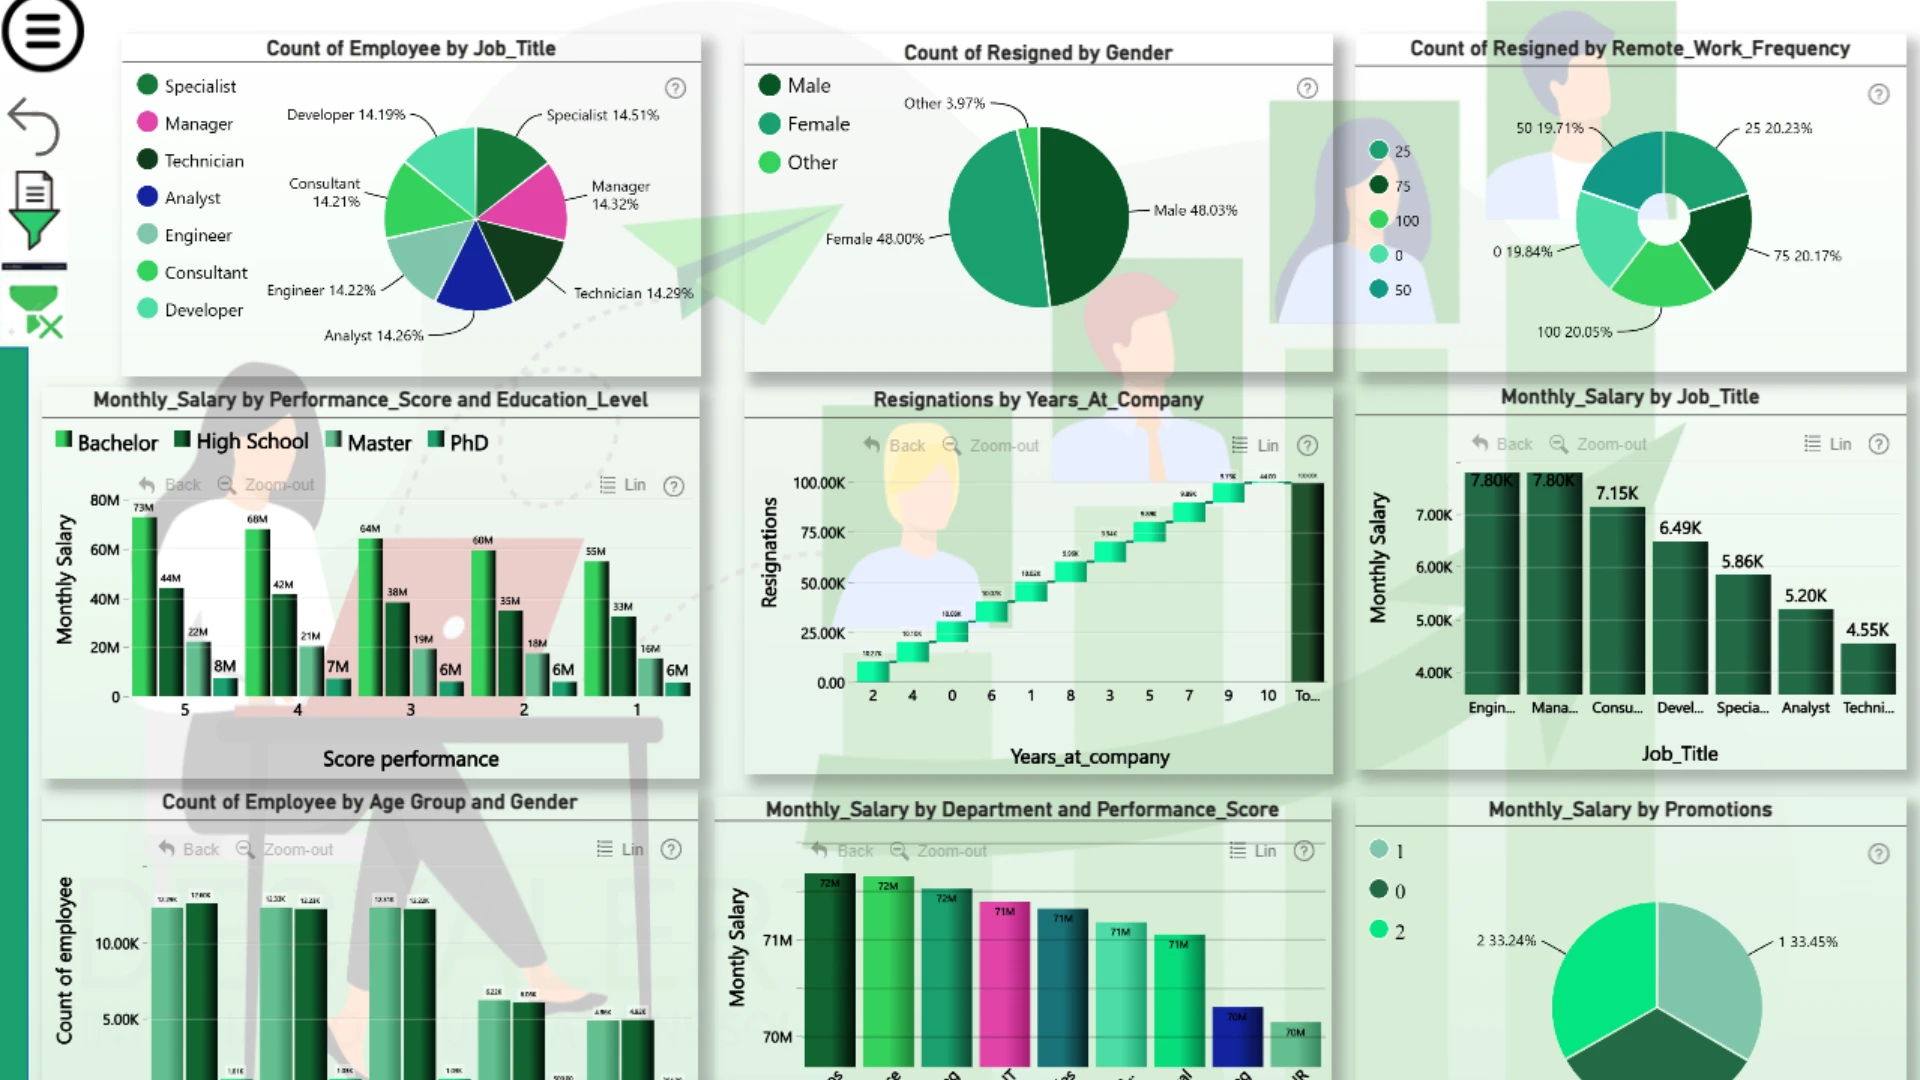
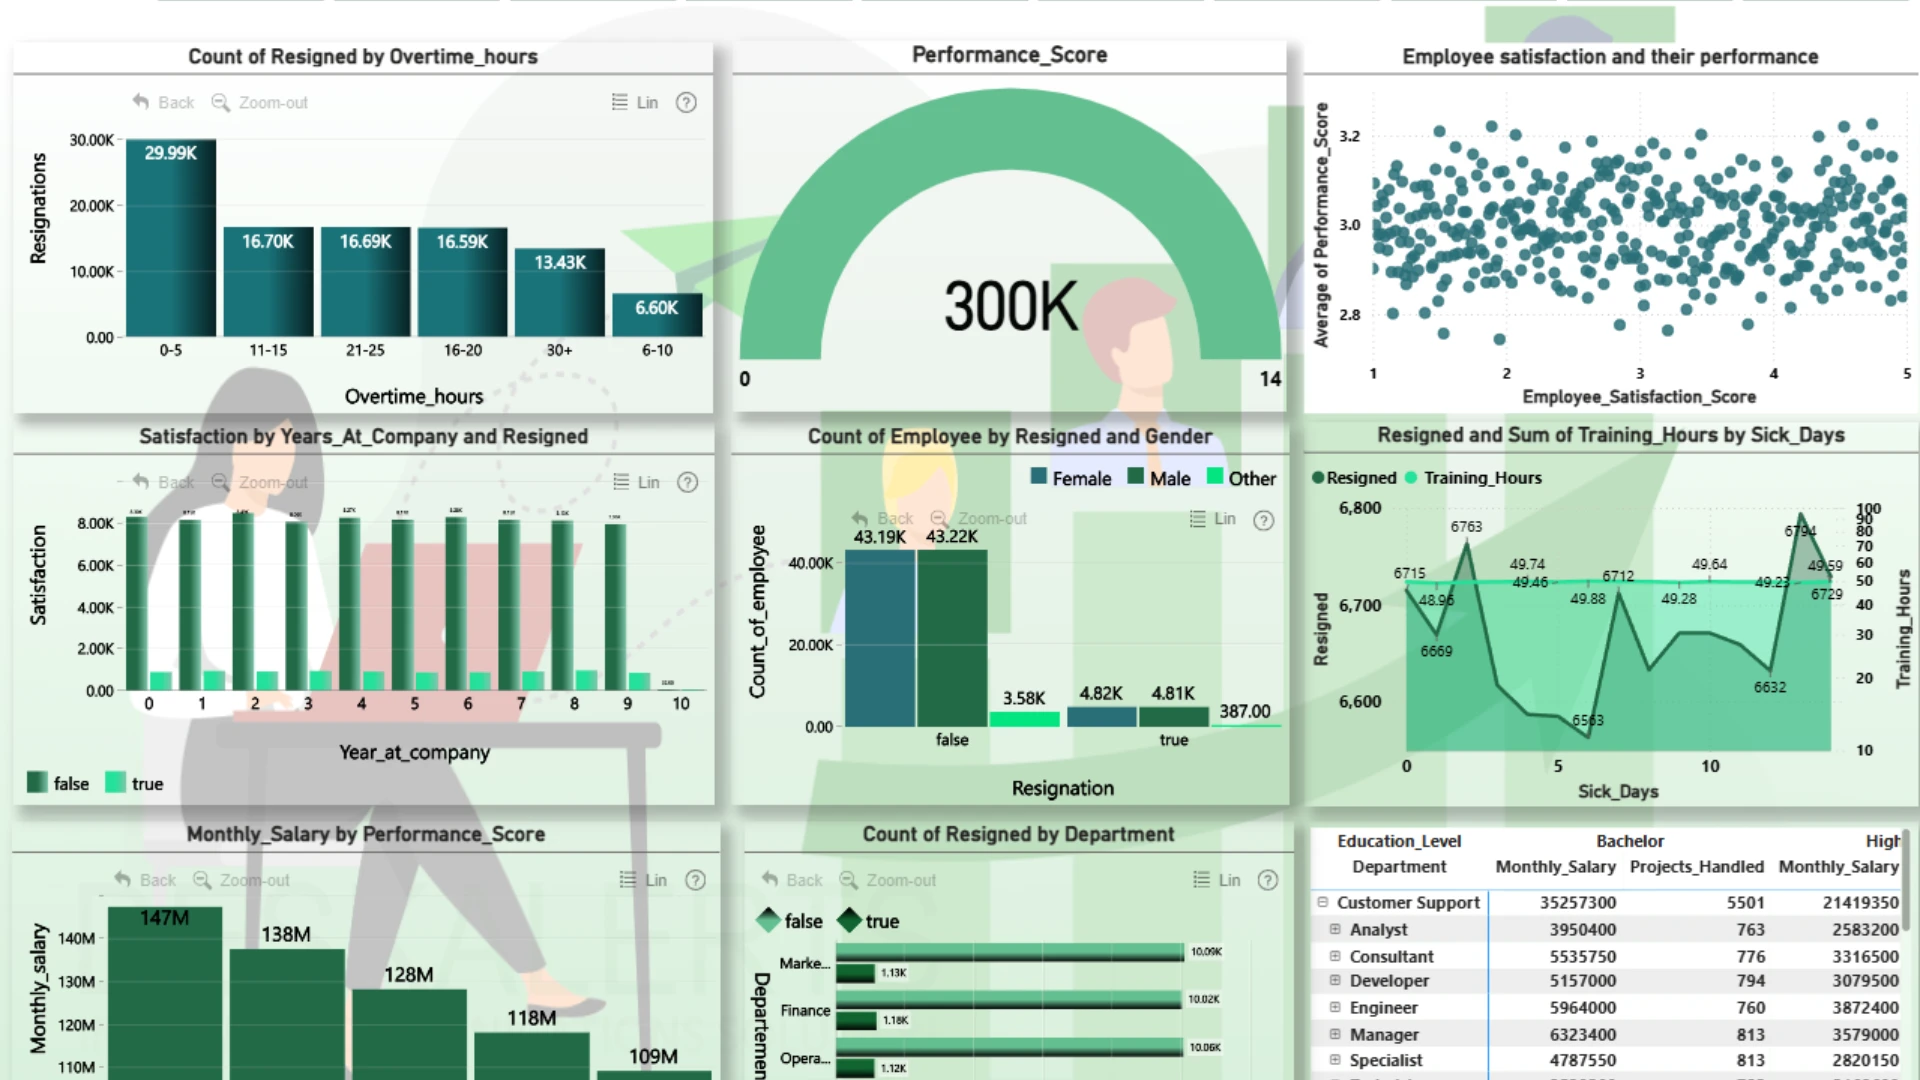
Report submitted for Onyx Data DataDNA ZoomCharts Mini Challenge, October 2024. The report was built based on Employee Performance dataset and includes ZoomCharts custom Drill Down PRO visuals for Power BI.
Author's description:
This project aims to analyze key factors that influence employee performance, satisfaction, and retention within the organization. Using a diverse dataset, I explored workforce demographics, departmental dynamics, job progression, and work-life balance to identify patterns impacting productivity. Key insights include salary disparities, the influence of workload on performance, and predictors of resignation. The analysis provides actionable strategies to improve employee engagement, optimize compensation structures, and foster organizational growth. This project empowers data-driven HR decisions, enhancing both employee well-being and business performance.
ZoomCharts visuals used





4U Report Challenges
Participate in data challenges, build and submit reports to get free template downloads.
Join CommunityMobile view allows you to interact with the report. To Download the template please switch to desktop view.
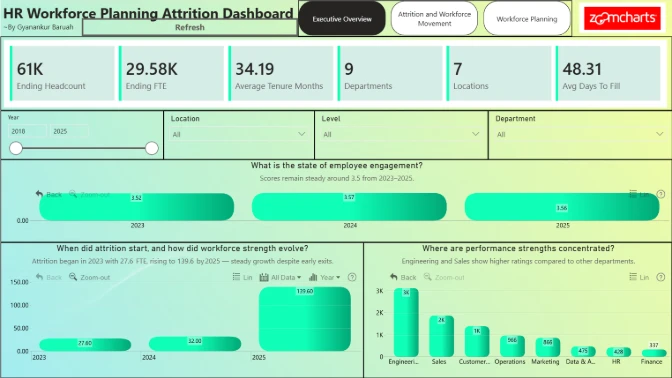
How to use a PBIX template
Preview the interactive report, download the PBIX file, open it in Power BI Desktop, and replace the same data connection with your own dataset.
Preview and download
Explore the report online and download the PBIX template file.
Open in Power BI Desktop
Open the downloaded PBIX file in Power BI Desktop.
Connect your data
Replace the sample data source with your own dataset.
Refresh and adjust
Refresh the model and update fields or visual were needed.
Save and share
Save your report and publish it for your audience.


