2011
Employee Metrics Report
Employee Metrics Report
More Report pages
Report Author: Jason Carl Martin Tupas
2011
Share template with others
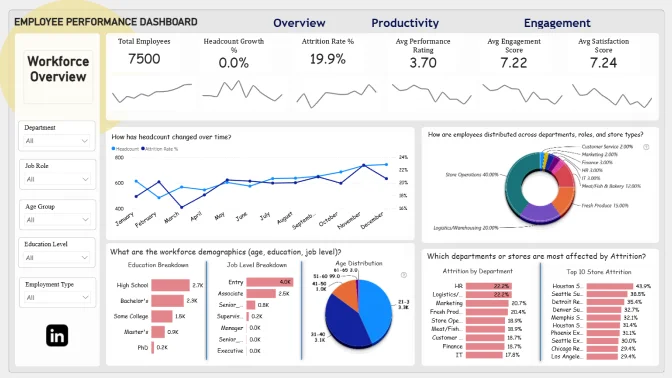
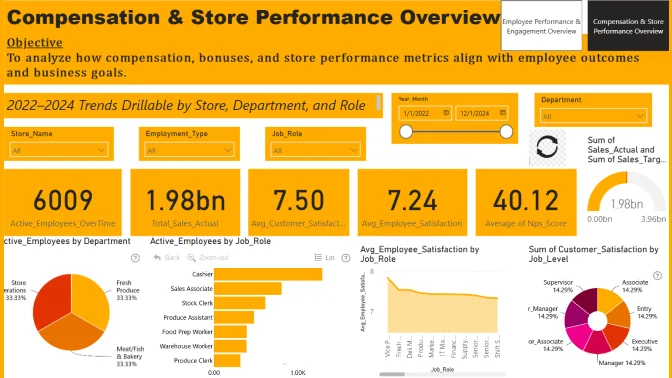
Report submitted for Onyx Data DataDNA ZoomCharts Mini Challenge, October 2024. The report was built based on Employee Performance dataset and includes ZoomCharts custom Drill Down PRO visuals for Power BI.
Author's description:
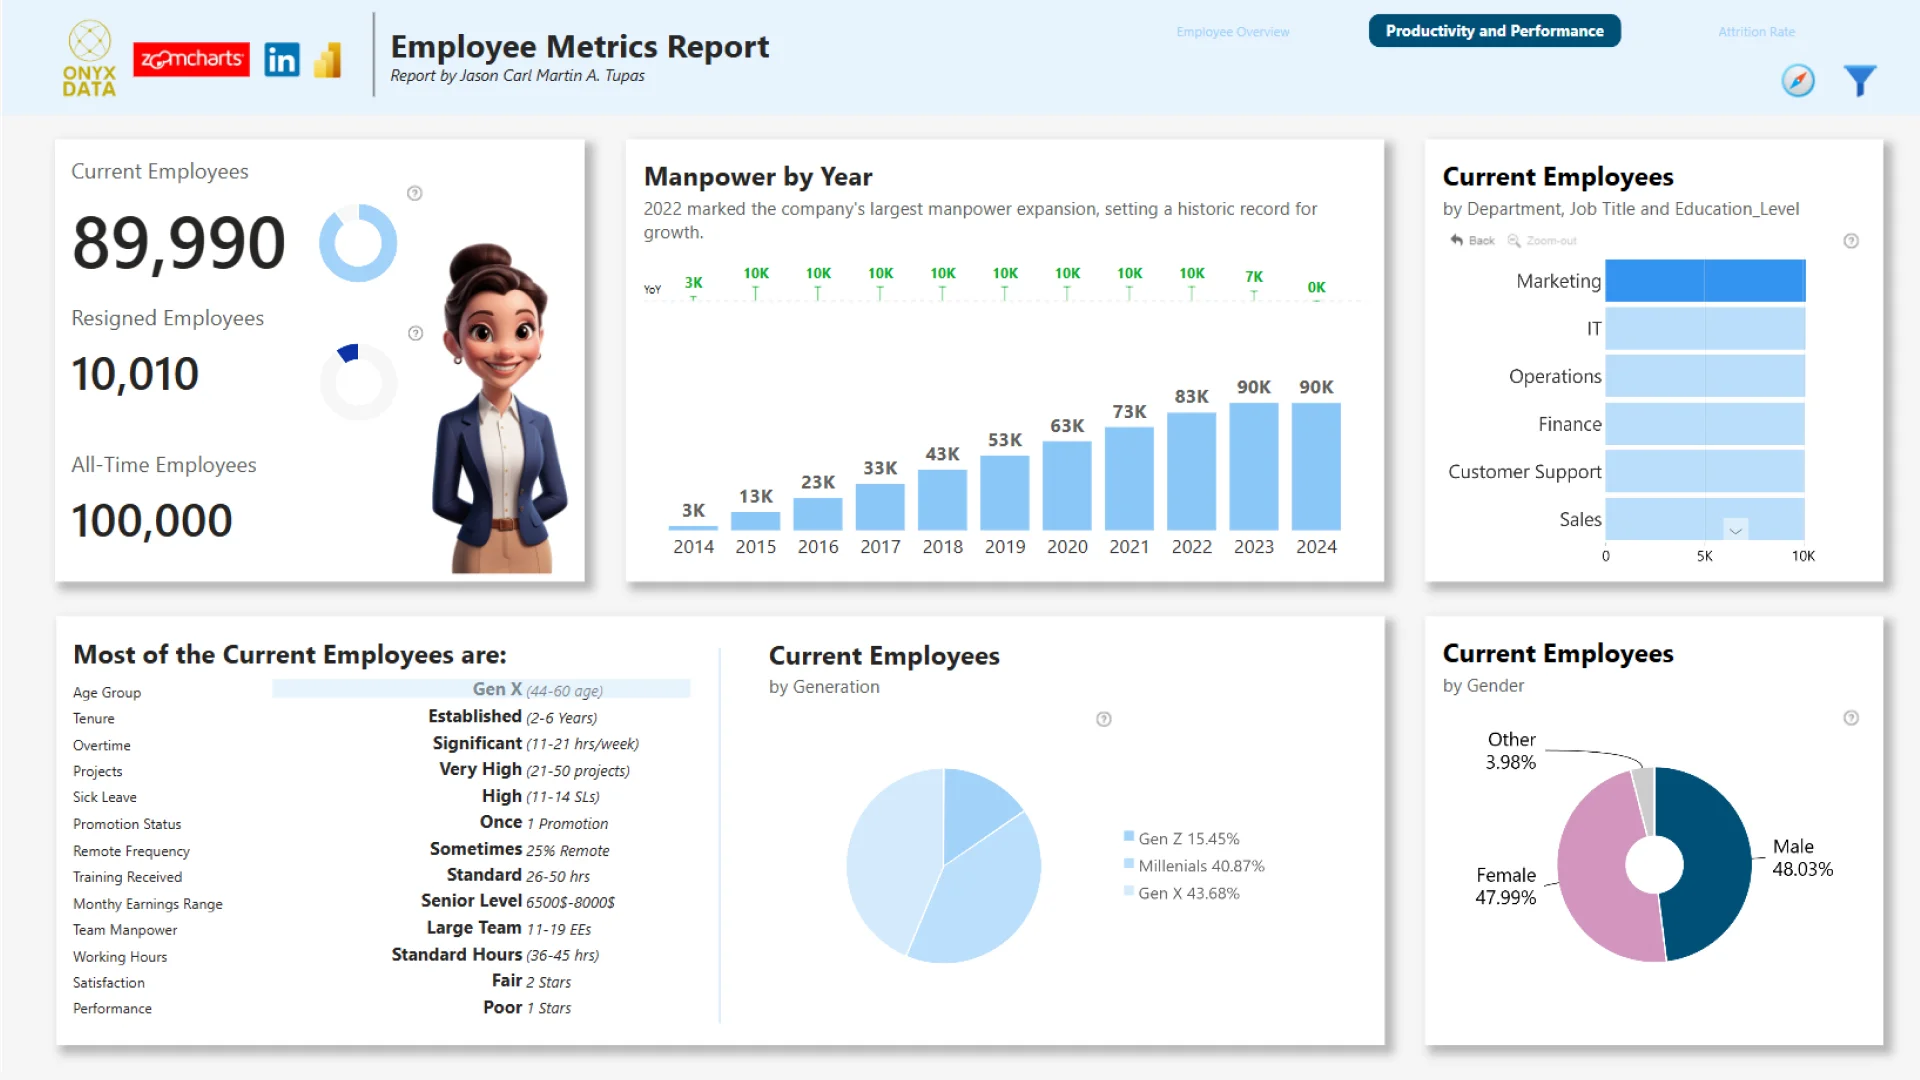
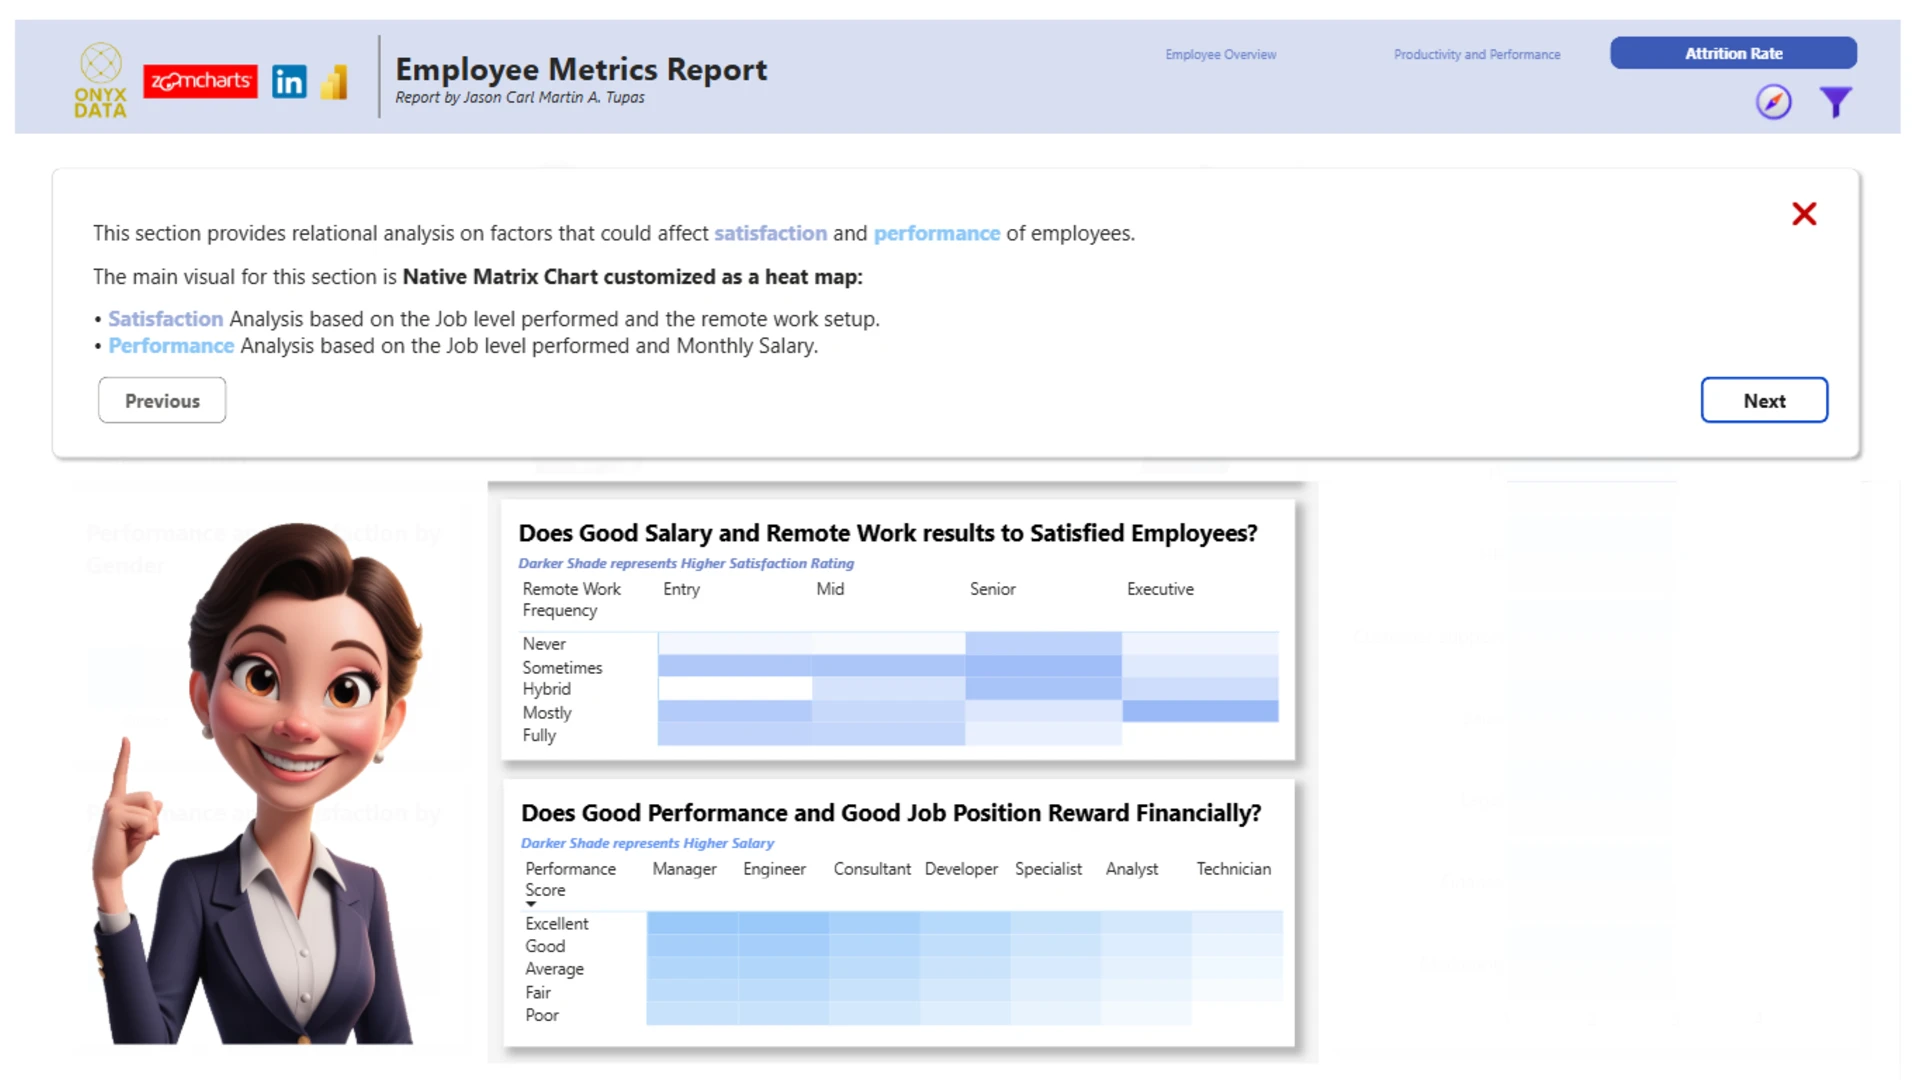
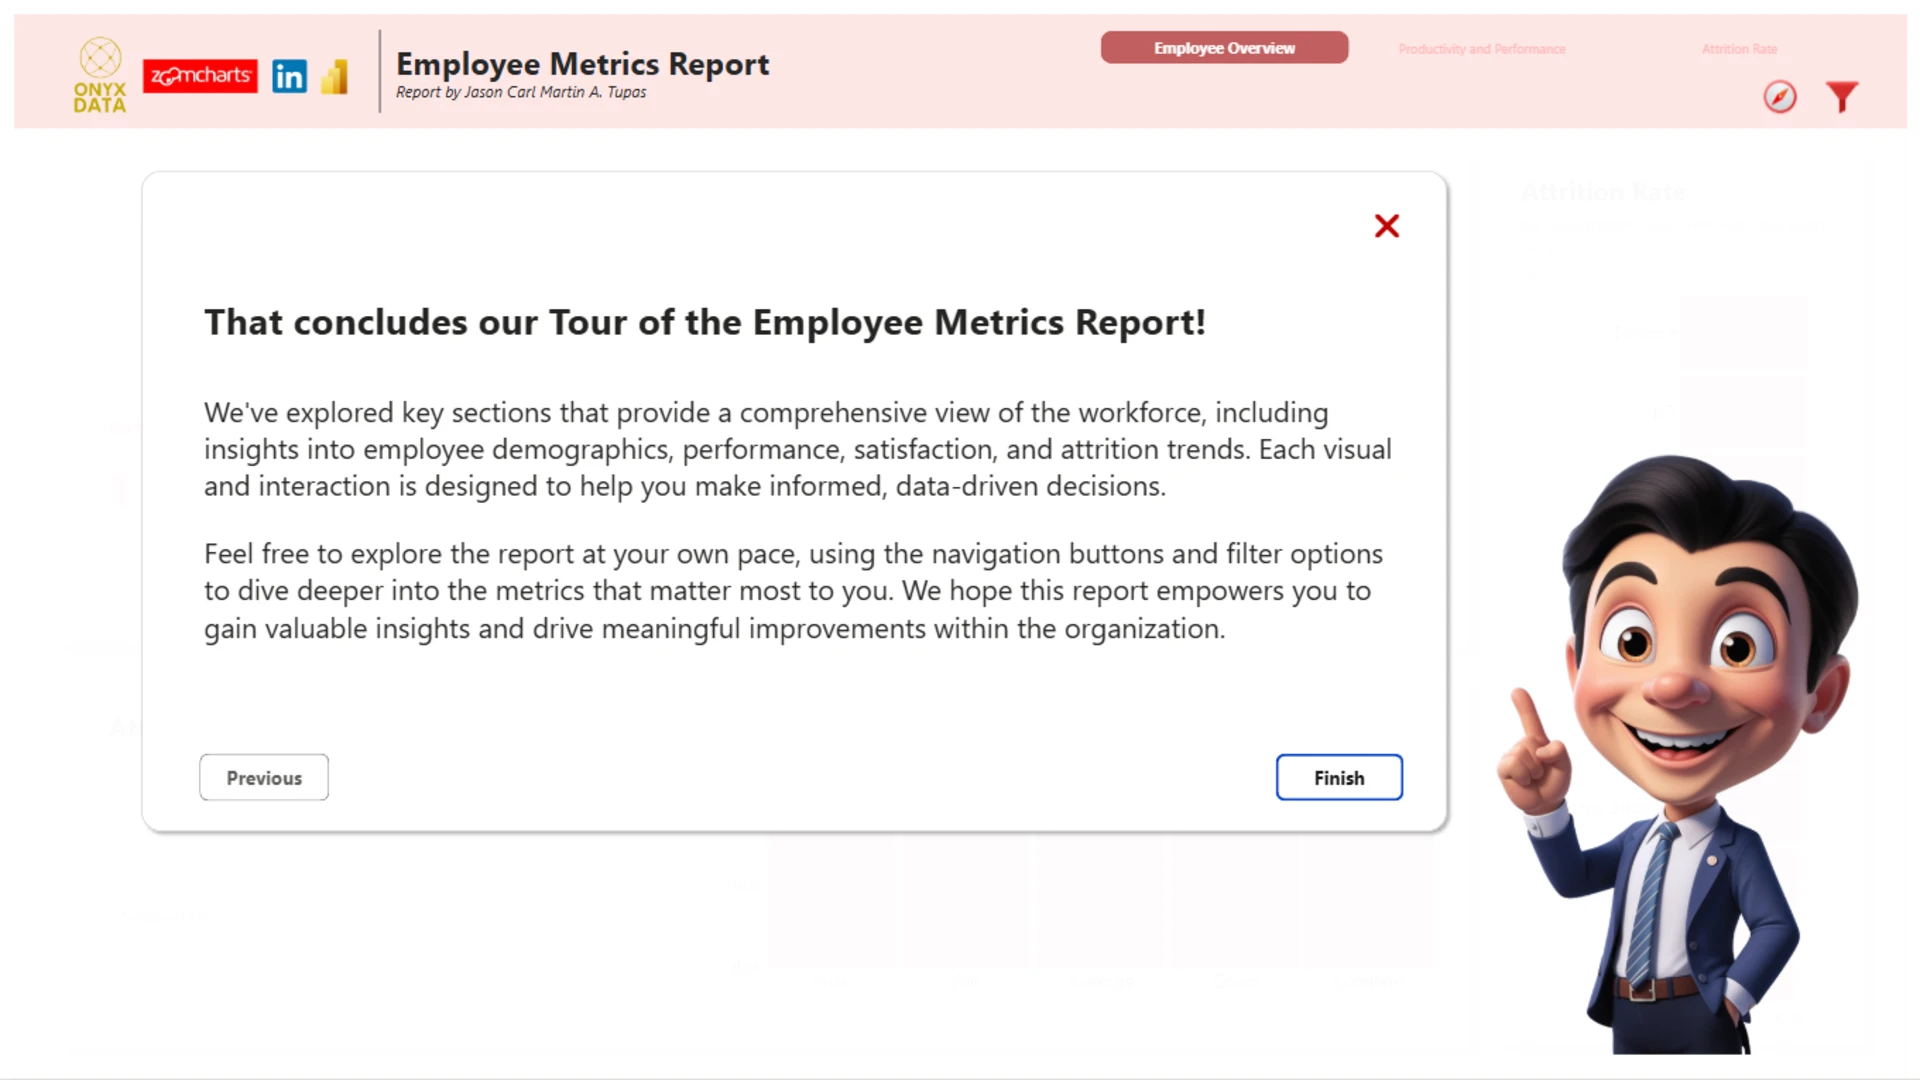
For this challenge, I created an interactive Power BI report that delivers key insights for HR and management teams. The report focuses on manpower overview, performance evaluation, productivity metrics, job satisfaction analysis, and the latest attrition trends. To enhance the aesthetic, I incorporated AI-generated animated employee images across the report, giving it a more engaging and personalized look. With a clean, intuitive layout and clear visuals, the three-page report also features a guided 'report tour' and a smart pop-up filter pane, leveraging the newest slicer features for seamless data exploration.
ZoomCharts visuals used
4U Report Challenges
Participate in data challenges, build and submit reports to get free template downloads.
Join CommunityMobile view allows you to interact with the report. To Download the template please switch to desktop view.
Was this helpful? Thank you for your feedback!
Sorry about that.
How can we improve it?