1184
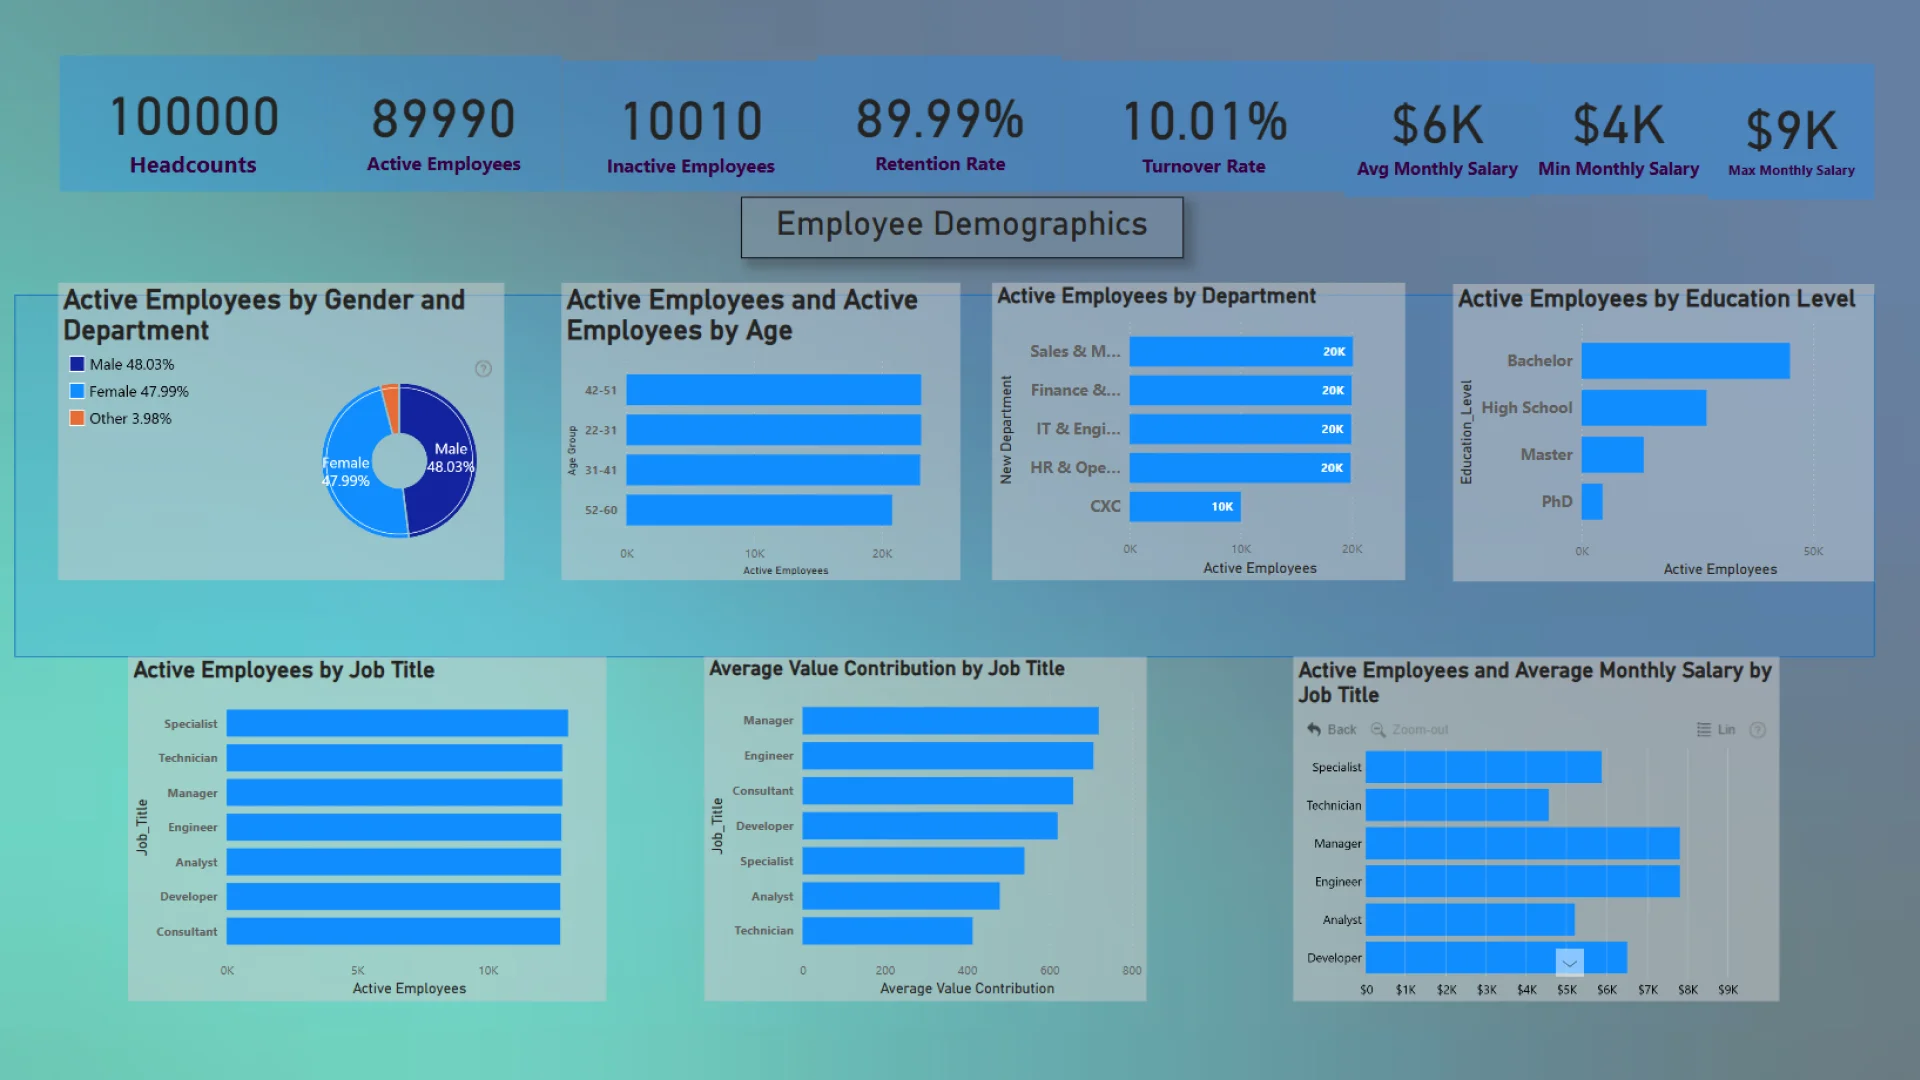
Employee Demographics
Employee Demographics
More Report pages
Report Author: Divyansh Raj
1184
Share template with others
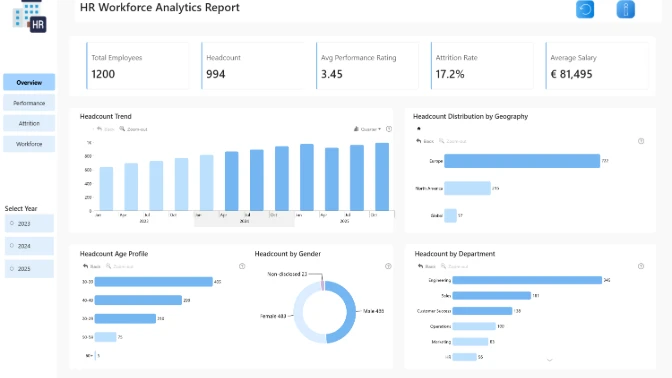
Report submitted for Onyx Data DataDNA ZoomCharts Mini Challenge, October 2024. The report was built based on Employee Performance dataset and includes ZoomCharts custom Drill Down PRO visuals for Power BI.
Author's description:
This dashboard offers a snapshot of the company’s workforce, covering key details such as department, gender, age, job title, years at the company, education level, performance score, monthly salary, work hours, projects handled, overtime, sick days, remote work frequency, team size, training hours and satisfaction score. It provides visual insights into demographic trends and employee contributions across various departments.
ZoomCharts visuals used
4U Report Challenges
Participate in data challenges, build and submit reports to get free template downloads.
Join CommunityMobile view allows you to interact with the report. To Download the template please switch to desktop view.
Was this helpful? Thank you for your feedback!
Sorry about that.
How can we improve it?