53
Emergency Room Operations Power BI Report
Emergency Room Operations Power BI Report
More Report pages
Report Author: Brian Ochigbo Sule
53
Share template with others
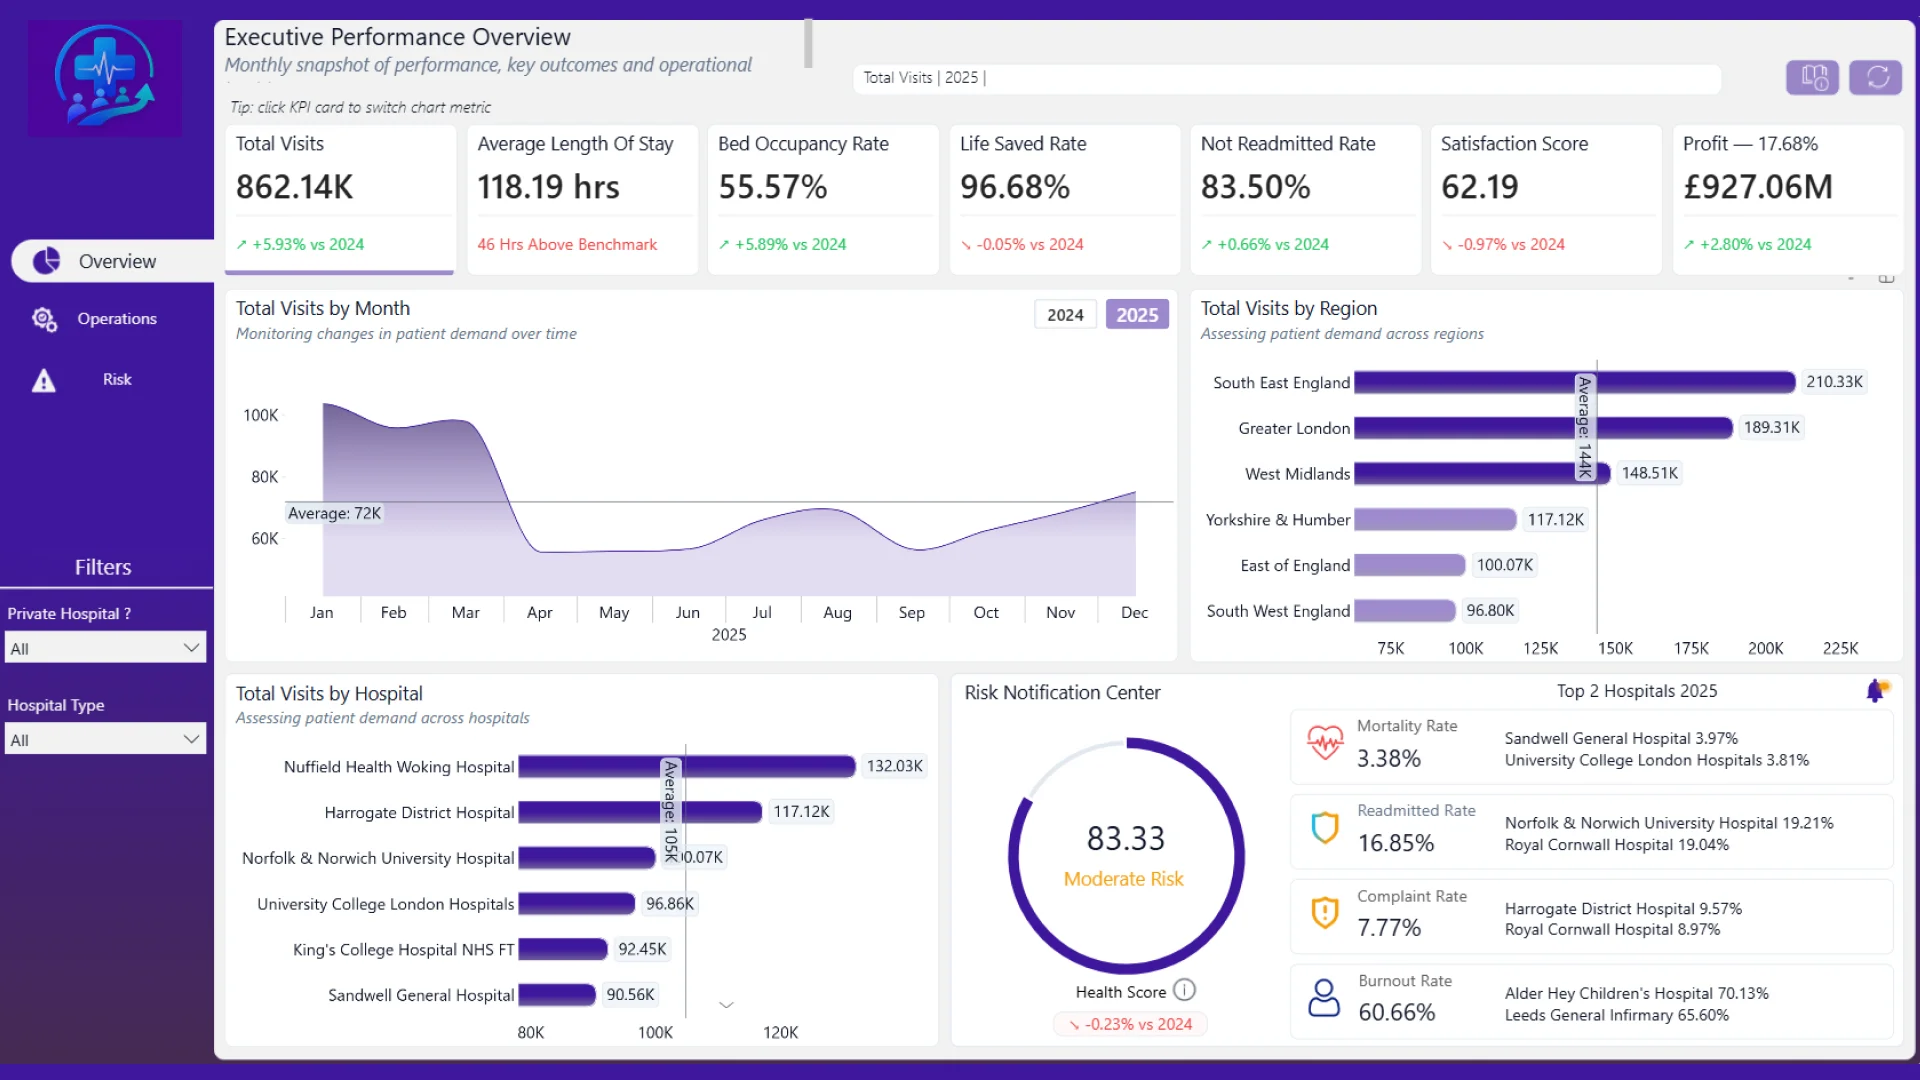
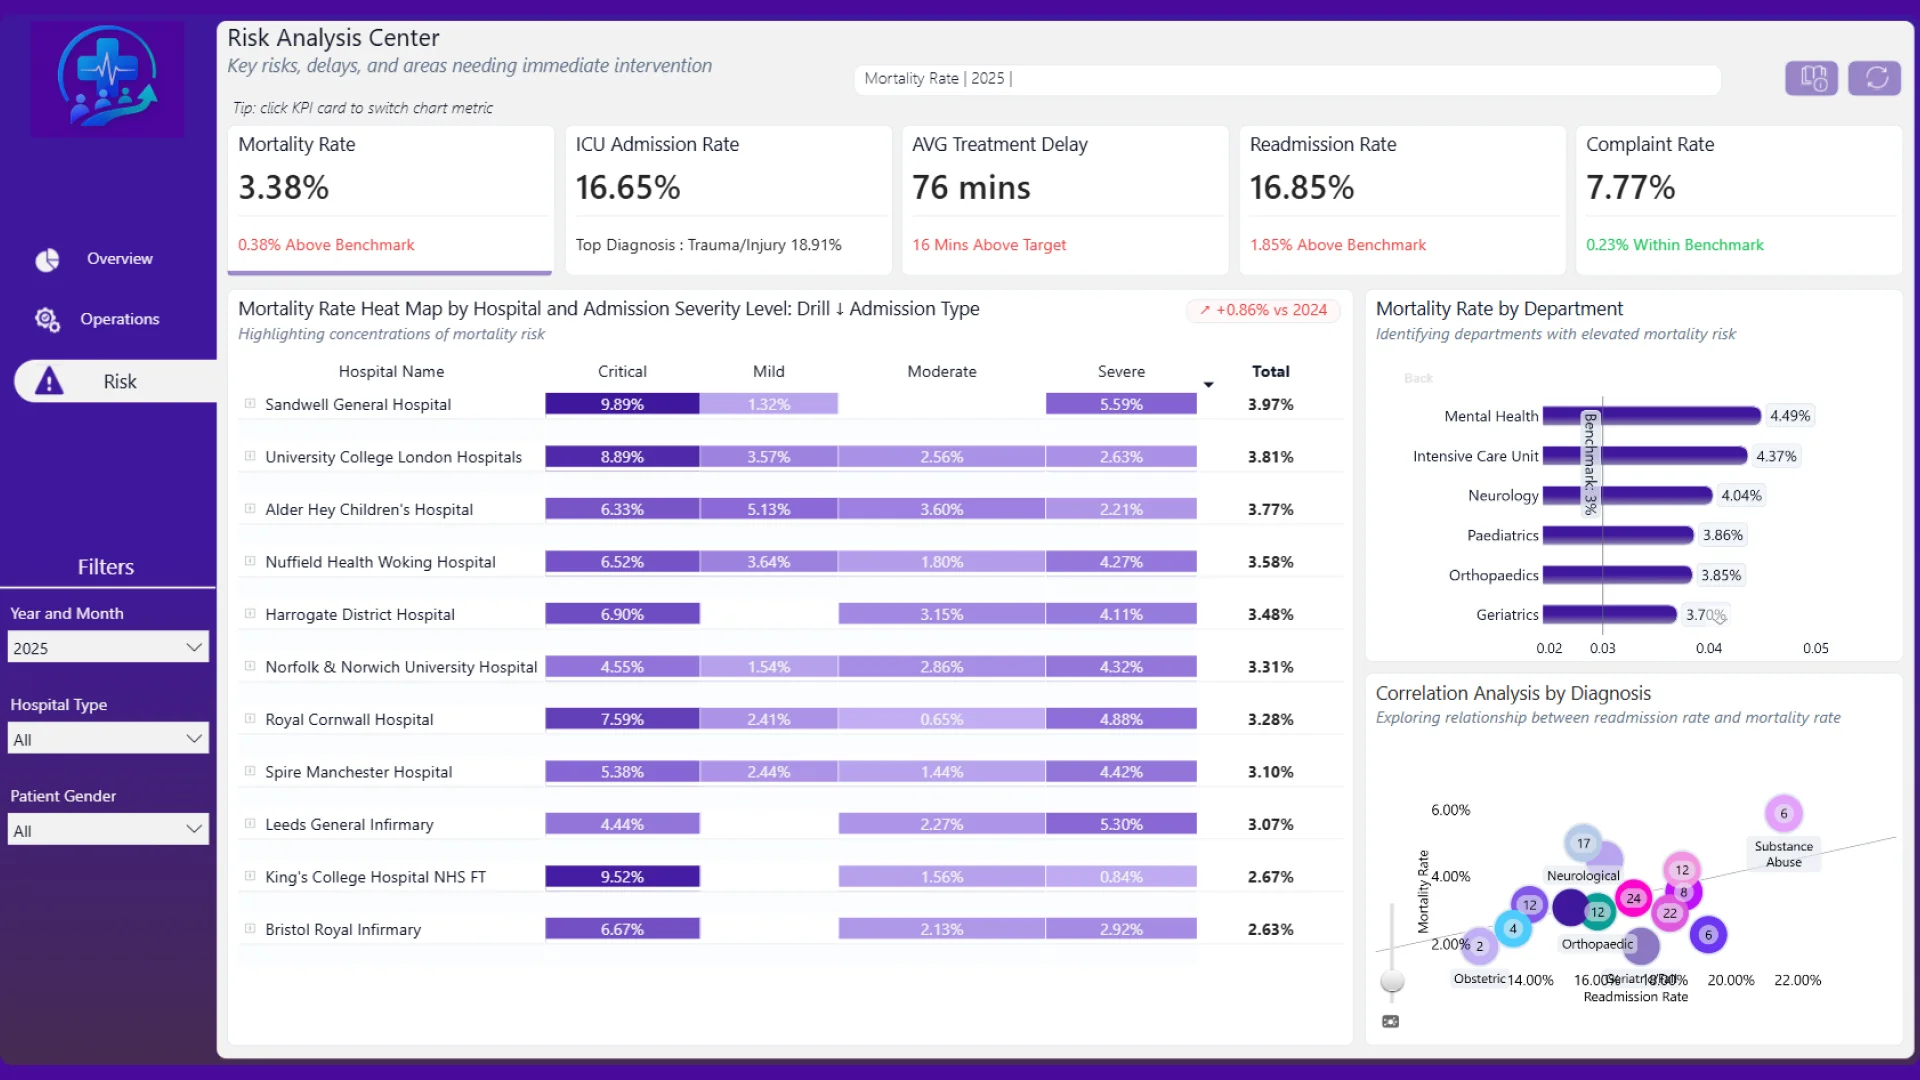
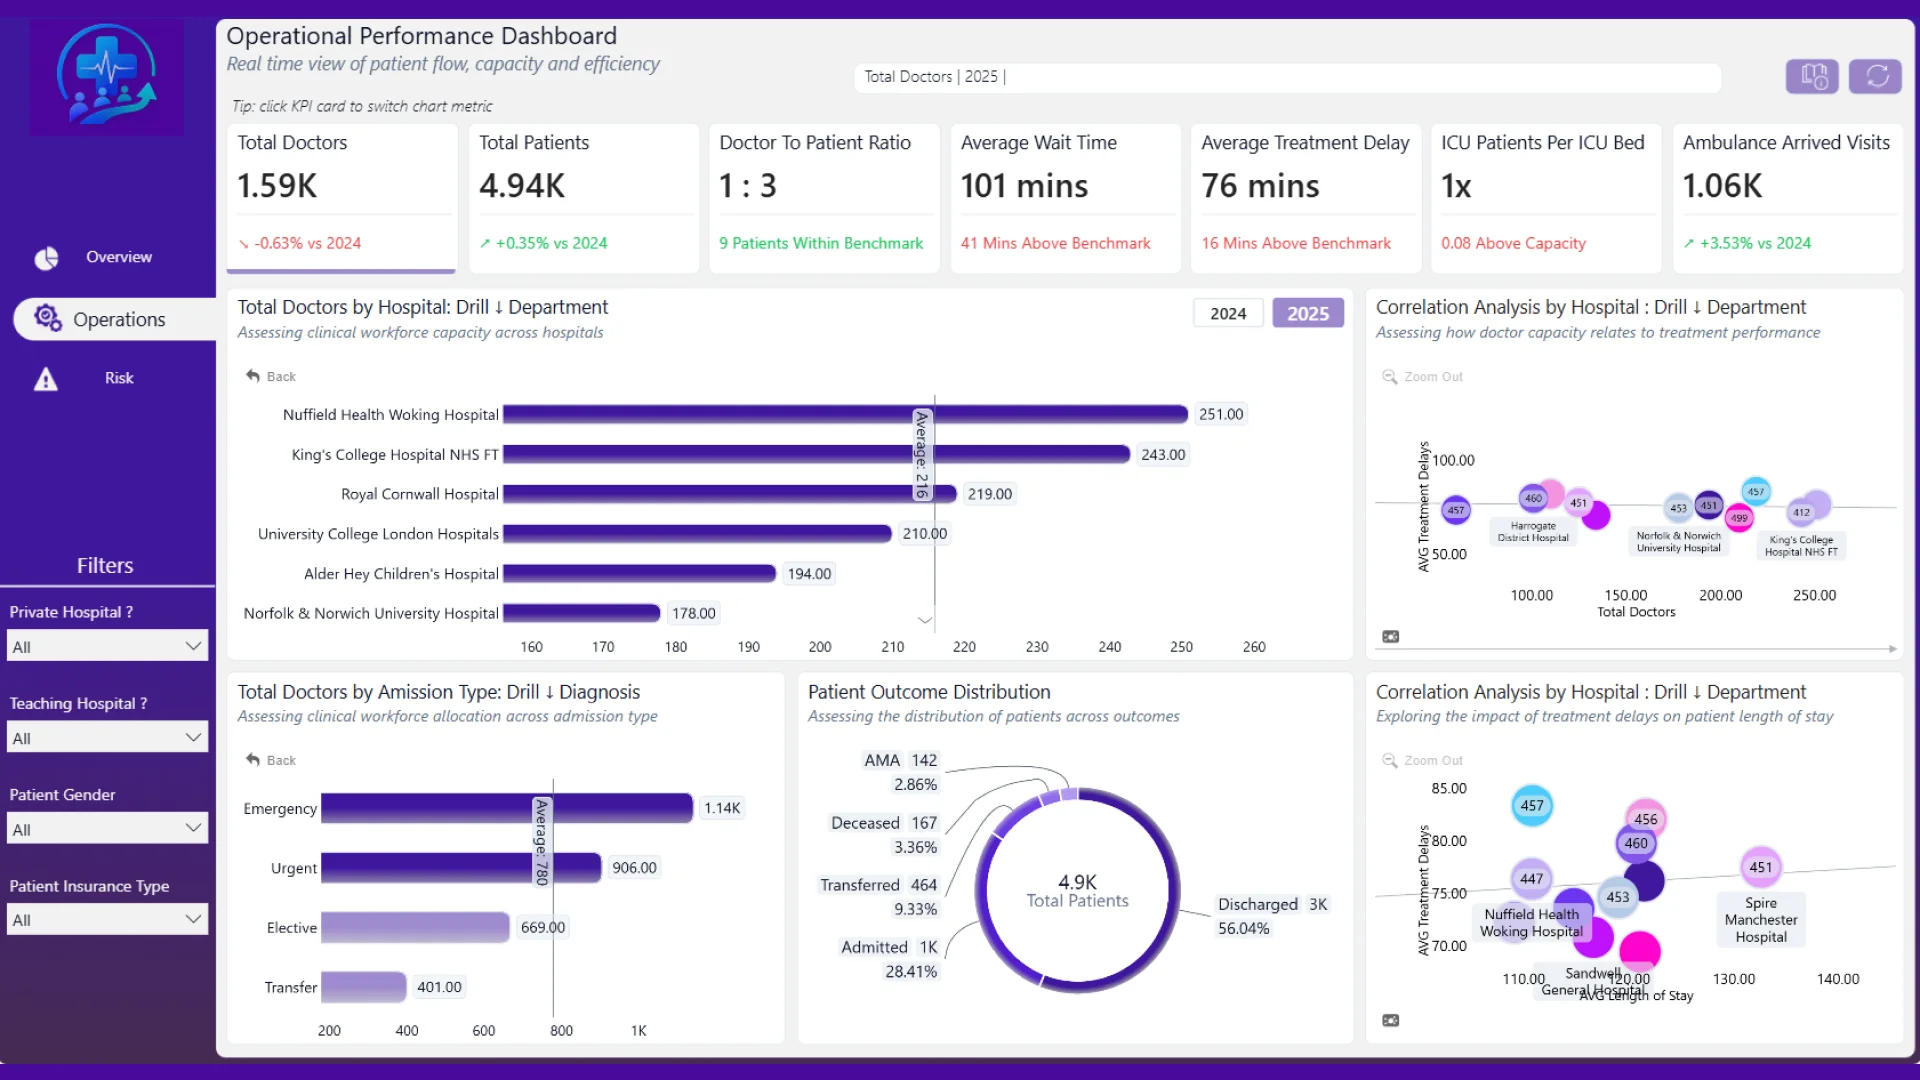
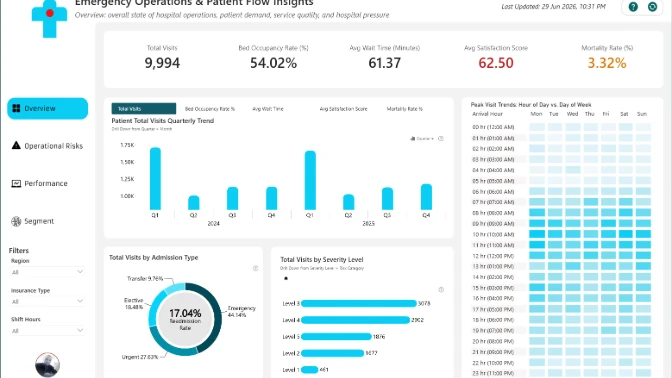
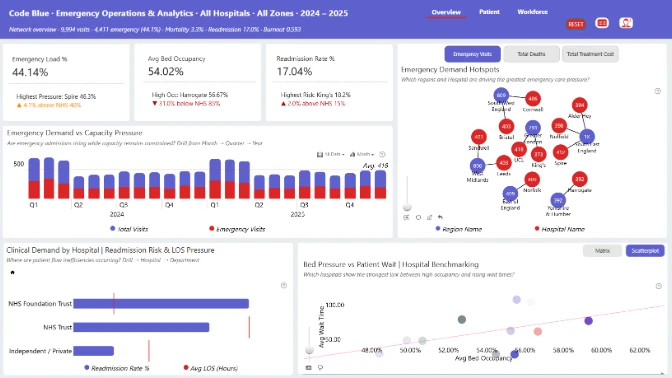
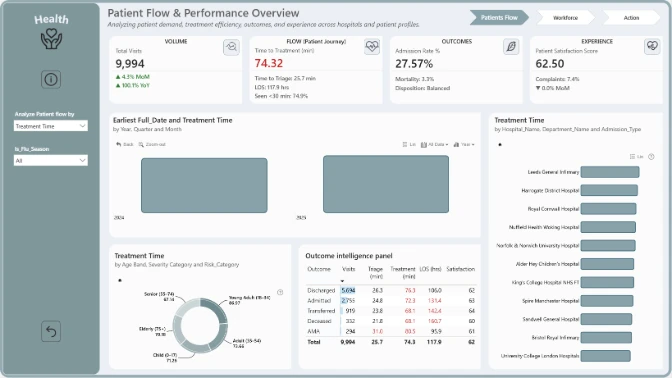
This interactive Power BI report explores the Code Blue Emergency Operations & Patient Flow dataset. It analyzes hospital performance, patient flow, bed capacity, emergency operations, pressure points, risks, inefficiencies, and outcome factors across hospitals and key healthcare segments.
Submitted to the FP20 Analytics ZoomCharts Data Challenge 38: Emergency Operations & Patient Flow Analytics, using native Power BI visuals and ZoomCharts Drill Down PRO custom visuals.
Author’s Description:
Resubmission of my entry (One Final Tweak) Reason: Trend Chart : Currently when the metrics "life saved rate, Not readmitted rate and Satisfaction Score" are selected, the trend chart doesn't show the flow by month efffectively, i fixed this by floating the "y axis" of the chart for proper flow visibility.
ZoomCharts visuals used
4U Report Challenges
Participate in data challenges, build and submit reports to get free template downloads.
Join CommunityMobile view allows you to interact with the report. To Download the template please switch to desktop view.
Was this helpful? Thank you for your feedback!
Sorry about that.
How can we improve it?