logo
For Power BI Report Templates
  • Products

    Drill Down Visuals for Power BI

    Discover the most customizable custom visuals for Power BI.

    Pricing & licensing
    • Drill Down Donut Pro
      Drill Down Donut Category Composition
    • Drill Down Pie Pro
      Drill Down Pie Proportional Breakdown
    • Drill Down Combo Pro
      Drill Down Combo Multi-Metric Trends
    • Drill Down Combo Bar Pro
      Drill Down Combo Bar Cross-Metric Trends
    • Drill Down Line Pro
      Drill Down Line Trend Analysis
    • Drill Down Bubble Pro
      Drill Down Bubble Value Relationships
    • Drill Down Scatter Pro
      Drill Down Scatter Correlation Analysis
    • Drill Down Network Pro
      Drill Down Network Entity Connections
    • Drill Down Graph Pro
      Drill Down Graph Relationship Mapping
    • Drill Down Map Pro
      Drill Down Map Geographic Insights
    • Drill Down Waterfall Pro
      Drill Down Waterfall Change Breakdown
    • Drill Down Timeline Pro
      Drill Down Timeline Time-Based Metrics
    • Drill Down TimeSeries Pro
      Drill Down TimeSeries Temporal Patterns
    • Drill Down Line Pro
      Drill Down Line Trend Analysis

    Visuals in Planning

    Discover visuals we’re exploring, share your feedback, and help us decide what to build next.

    Browse concepts
  • Template Reports
    • Browse Report Templates
      Browse Report Templates Explore 2000+
      Power BI reports
    • Pricing Report Templates
      unlimited access

    Explore Report Templates

    Industry

    • Logistics
    • Education
    • Healthcare
    • Transportation
    • Banking
    • Ecommerce
    • Crime analytics
    • Retail
    • Manufacturing

    Business Domain

    • Sales
    • Marketing
    • Accounting & Finance
    • Human Resources
    • Research
    • Project Management
    • CRM
    • Support
    • Customer experience
  • Resources

      Learn

    • Video Tutorials Step-by-step Power BI guides
    • Webinars Live and recorded expert sessions
    • Visuals Gallery Explore all custom Power BI visuals
    • Blog Power BI tips, updates, and guides
    • Documentation Setup, features, and API reference

    Support

    • ZoomCharts Assistance Help from our product experts
    • Contact Sales Questions about pricing or licensing
    • Contact Support Technical help and troubleshooting
    • FAQ Quick answers to common questions
  • Services
    • Power BI Report Development
      Power BI Report Development End-to-end custom
      Power BI reports.
    • Custom Visual Development
      Custom Visual Development Custom visuals for
      your business needs.
  • Challenges
  • Pricing
Get started
Get started
Get it now
Go back

Contents

Dashboard and report examples Email Marketing Performance
Go back

561

Email Marketing Performance

Email Marketing Performance

Report
Report Interact

Report Author: Lina Phuong Tran

561

Scatter Pie Combo Timeline

Share template with others
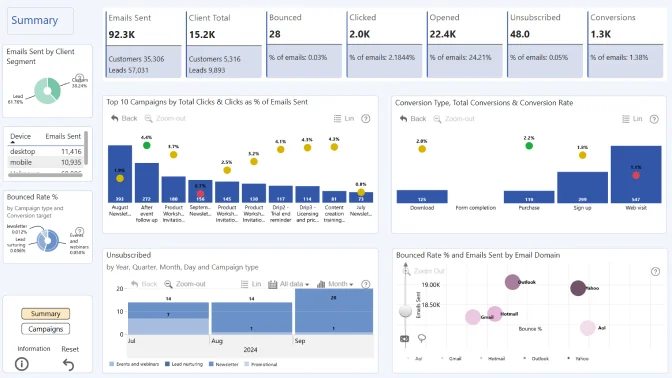
Report submitted for the FP20 Analytics ZoomCharts Challenge, October 2024. The report was built using the Marketing Email Campaign performance dataset and includes ZoomCharts custom Drill Down PRO visuals for Power BI.

Author's Description:

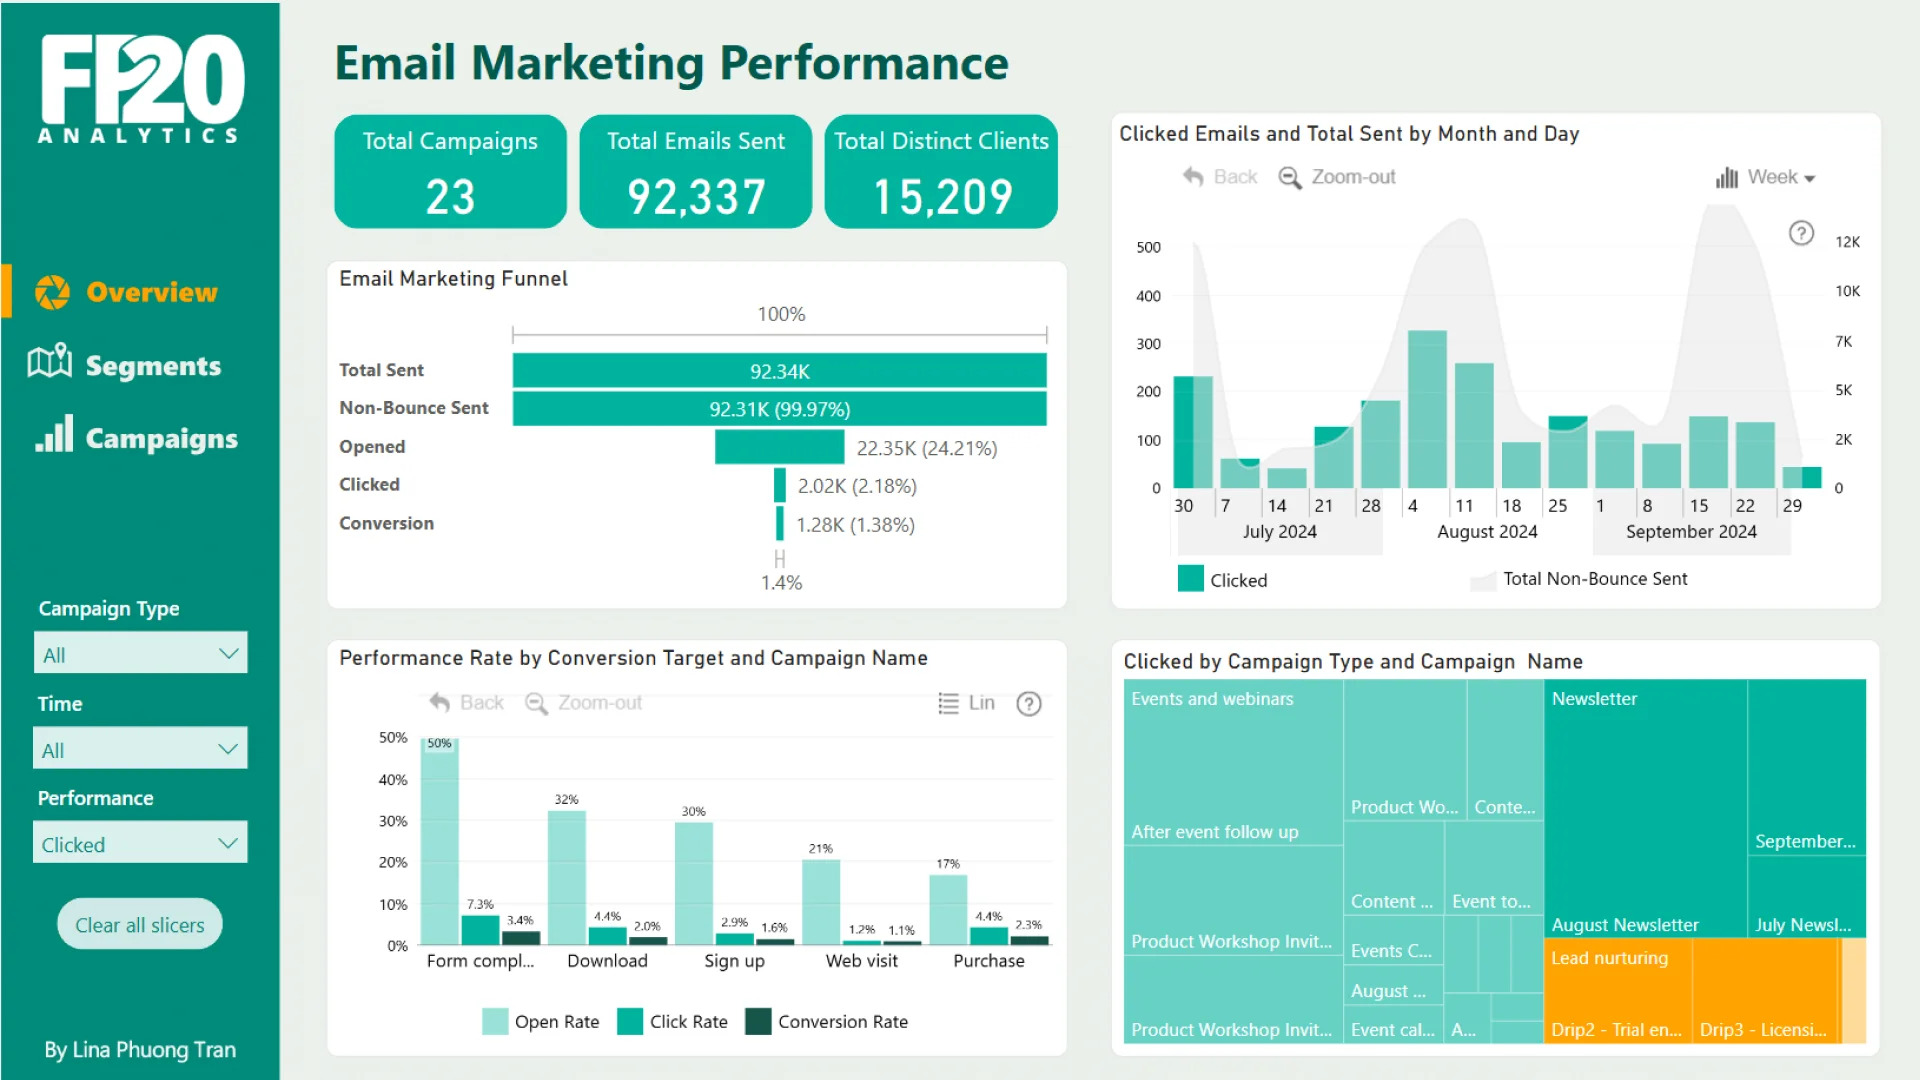
The dashboard illustrates the performance of 23 email marketing campaigns from July to September 2024.

Key Findings:

  1. Email Reliability:
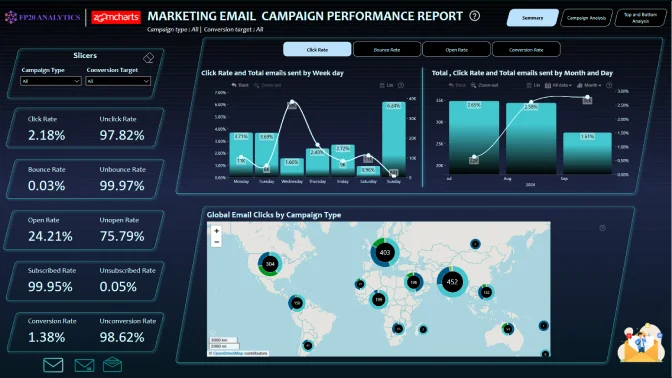
    With an unbounced email rate of 99.97% and an open rate of 24.21%, equivalent to the industry average, the current email directory appears reliable, containing few inactive or counterfeit emails.

  2. Top-Performing Campaigns:
    Promotional campaigns showed the best performance in both engagement and conversion. Event and webinar campaigns also observed positive interactions, particularly in surveys related to event topics, training invitations, and follow-ups after events.
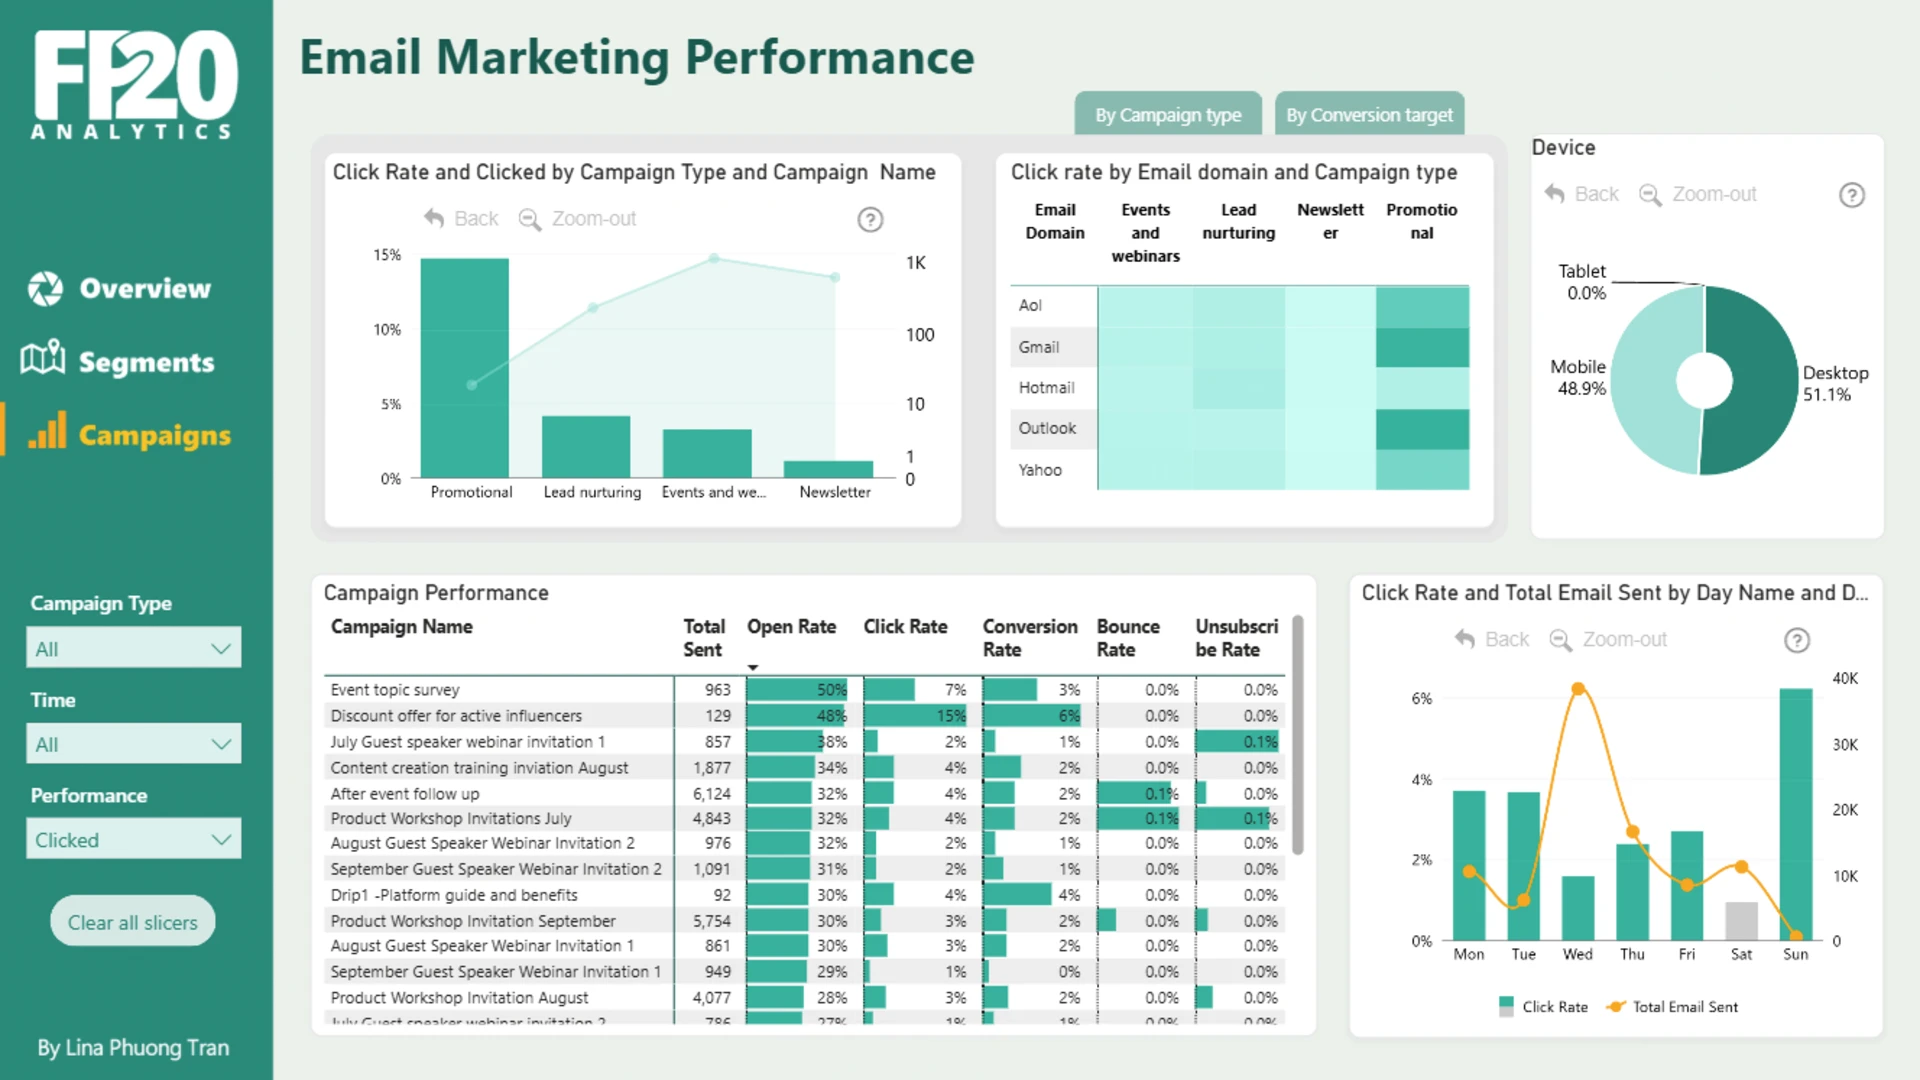
  3. Unsubscribe Rate:
    Higher unsubscribe rates were noted in campaigns such as the monthly Newsletter and Events & Webinars, especially when accessed via desktop.
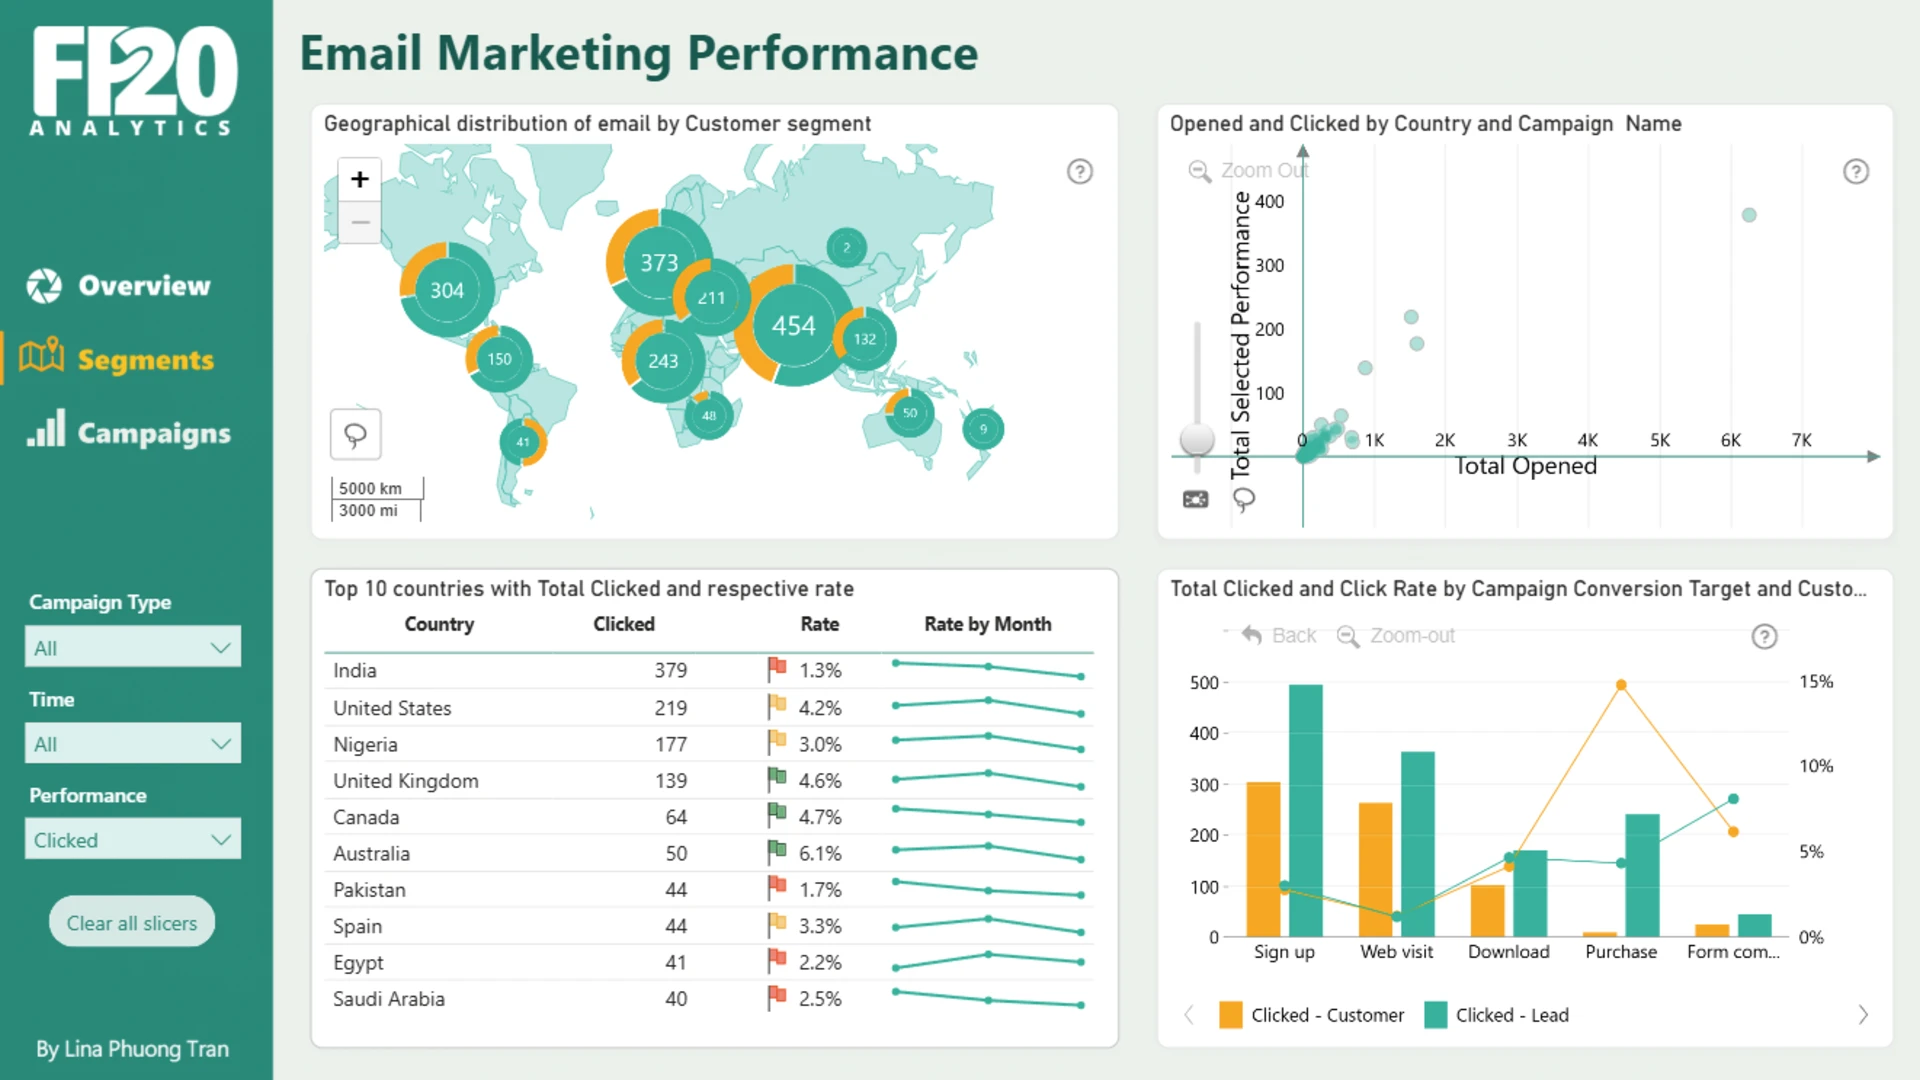
  4. Market Performance:
    Among the three main markets—India, the US, and Nigeria—the US had the highest performance, exceeding the average in opens, clicks, and conversions. Nigeria showed strong open and click rates but a lower conversion rate, while India had relatively low engagement and conversion.

  5. Client Segments:
    While the Lead Client Segment is slightly larger than the Customer Client Segment, their behaviors are similar across campaigns. However, Customer Clients respond better to Purchase campaigns, while Lead Clients are more engaged in Form completion campaigns, such as event topic surveys.

  6. Email Domain Performance:
    Outlook and Gmail outperformed other domains, while Yahoo had the highest bounce rate.

  7. Day of the Week Performance:
    Saturday consistently showed the lowest performance. Monday and Tuesday had impressive open rates, while Sunday, despite a lower open rate, had higher click and conversion rates compared to other days.

ZoomCharts visuals used

Drill Down Scatter PRO Drill Down Scatter PRO
Drill Down Combo PRO Drill Down Combo PRO
Drill Down Pie PRO Drill Down Pie PRO
Drill Down Timeline PRO Drill Down Timeline PRO

4U Report Challenges

Participate in data challenges, build and submit reports to get free template downloads.

Join Community

Mobile view allows you to interact with the report. To Download the template please switch to desktop view.

Similar reports

All Reports 2 results
New
Report Card

E-MAIL CAMPAIGN PERFORMANCE ANALYSIS

512

New
Report Card

Marketing Email Campaign Performance 23

665

Explore all reports

Was this helpful? Thank you for your feedback!

Sorry about that.

How can we improve it?

Email Marketing Performance

Report Author: Lina Phuong Tran

561

ZoomCharts

Welcome to ZoomCharts

You’re almost there! Create an account to download reports.

or
Sign up with Microsoft

Verify your email address

We have sent a code to your email address. Please input the code below.

Didn't receive code? Request again (after 30 seconds)

Already have an account? Log in

ZoomCharts

Log in to your ZoomCharts account

Log in with Microsoft
or
Forgot password?

Reset your password

We'll email you instructions on how to reset your password

Don't have an account? Sign up

Please add credits

You have 0 available downloads.
Get more credits or upgrade your plan to continue.

View pricing
logo
[email protected]
+44 204 577 3993
logo

Products

Drill Down Bubble PRO Drill Down Line PRO Drill Down Network PRO Drill Down Waterfall PRO Drill Down Graph PRO Drill Down Combo PRO Drill Down Combo Bar PRO Drill Down Donut PRO Drill Down Pie PRO Drill Down TimeSeries PRO Drill Down Timeline PRO Drill Down Map PRO Drill Down Scatter PRO All Visuals

Resources

Report Examples Webinars Blog ZoomCharts Academy Visuals Gallery Documentation Custom Visual Development Subscribe to News

Solutions

Custom Visual Development

Company

Pricing About Us Partners Leave feedback Join PowerGroup EU Funding

Help

ZoomCharts Assistance Contact Sales Contact Support FAQ AI Information

Drill Down Line PRO Drill Down Bubble PRO Drill Down Network PRO Drill Down Waterfall PRO Drill Down Graph PRO Drill Down Combo PRO Drill Down Combo Bar PRO Drill Down Donut PRO Drill Down Pie PRO Drill Down TimeSeries PRO Drill Down Timeline PRO Drill Down Map PRO Drill Down Scatter PRO All Visuals

Report Examples Webinars Blog ZoomCharts Academy Visuals Gallery Documentation Custom Visual Development Subscribe to News

Custom Visual Development

Pricing About Us Partners Leave feedback Join PowerGroup EU Funding

ZoomCharts Assistance Contact Sales Contact Support FAQ AI Information
+44 204 577 3993
[email protected]

Ready to get in touch?

Contact our experts with any question about Power BI and ZoomCharts for Free!

Contact us

© 2026, Data Visualization Software Lab

U.S. Patents No. 11,645,343; 11,921,804; 12,346,389

Cookies
Privacy Policy
Global
Legal
Patent
warning

Error message

success

Success info: Done!

ZoomCharts AI Assistant

We noticed you're using an old OS version.

For the best experience, we recommend upgrading to ensure that all website features display correctly.

Cookie settings

We use necessary cookies for site functionality, as well as statistic, marketing, and preference cookies to enhance your experience. For more information and to manage your preferences, please visit our Cookie policy