1262
Electronics Products Ratings and Reviews
Electronics Products Ratings and Reviews
More Report pages
Report Author: Siflis Hajnalka
1262
Share template with others
Report submitted for Onyx Data DataDNA ZoomCharts Mini Challenge, February 2024. The report was built based on Electronics Product Data Ratings dataset and includes ZoomCharts custom Drill Down PRO visuals for Power BI.
Author's description:
The report provides an extensive analysis of customer ratings and reviews for electronic products. I utilized tooltips and drill down visualizations so that users can easily access additional information and gain deeper insights into the data with just a hover or click.
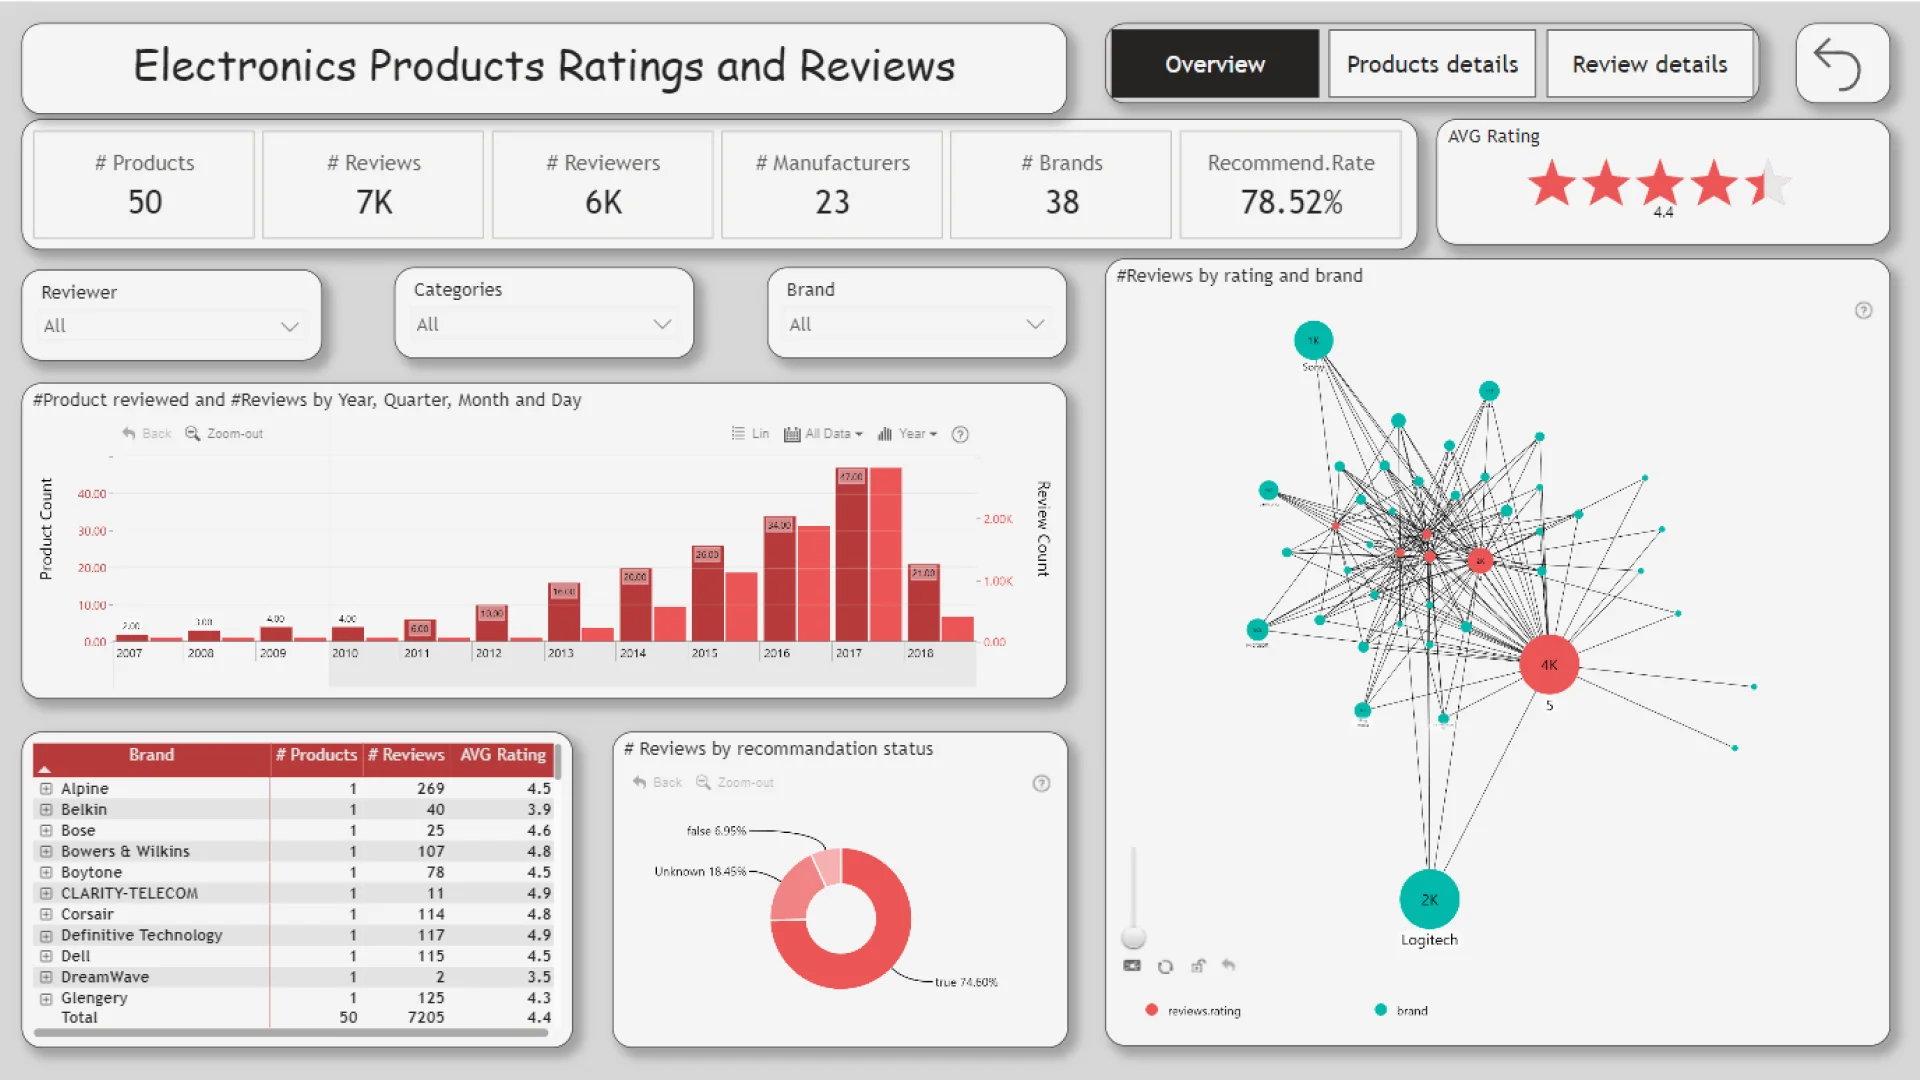
◾ # Products Reviewed and # Reviews by Date: This analysis tracks the trends in the number of products reviewed over time, alongside the total number of reviews received, enabling stakeholders to identify patterns and seasonality.
◾ Total Reviews by Recommendation: A breakdown of reviews by recommendation status offers a comprehensive understanding of customer sentiment and satisfaction levels.
◾ # Reviews by rating and brand: The network chart visualize the connection between ratings and number of ratings for specific brands.
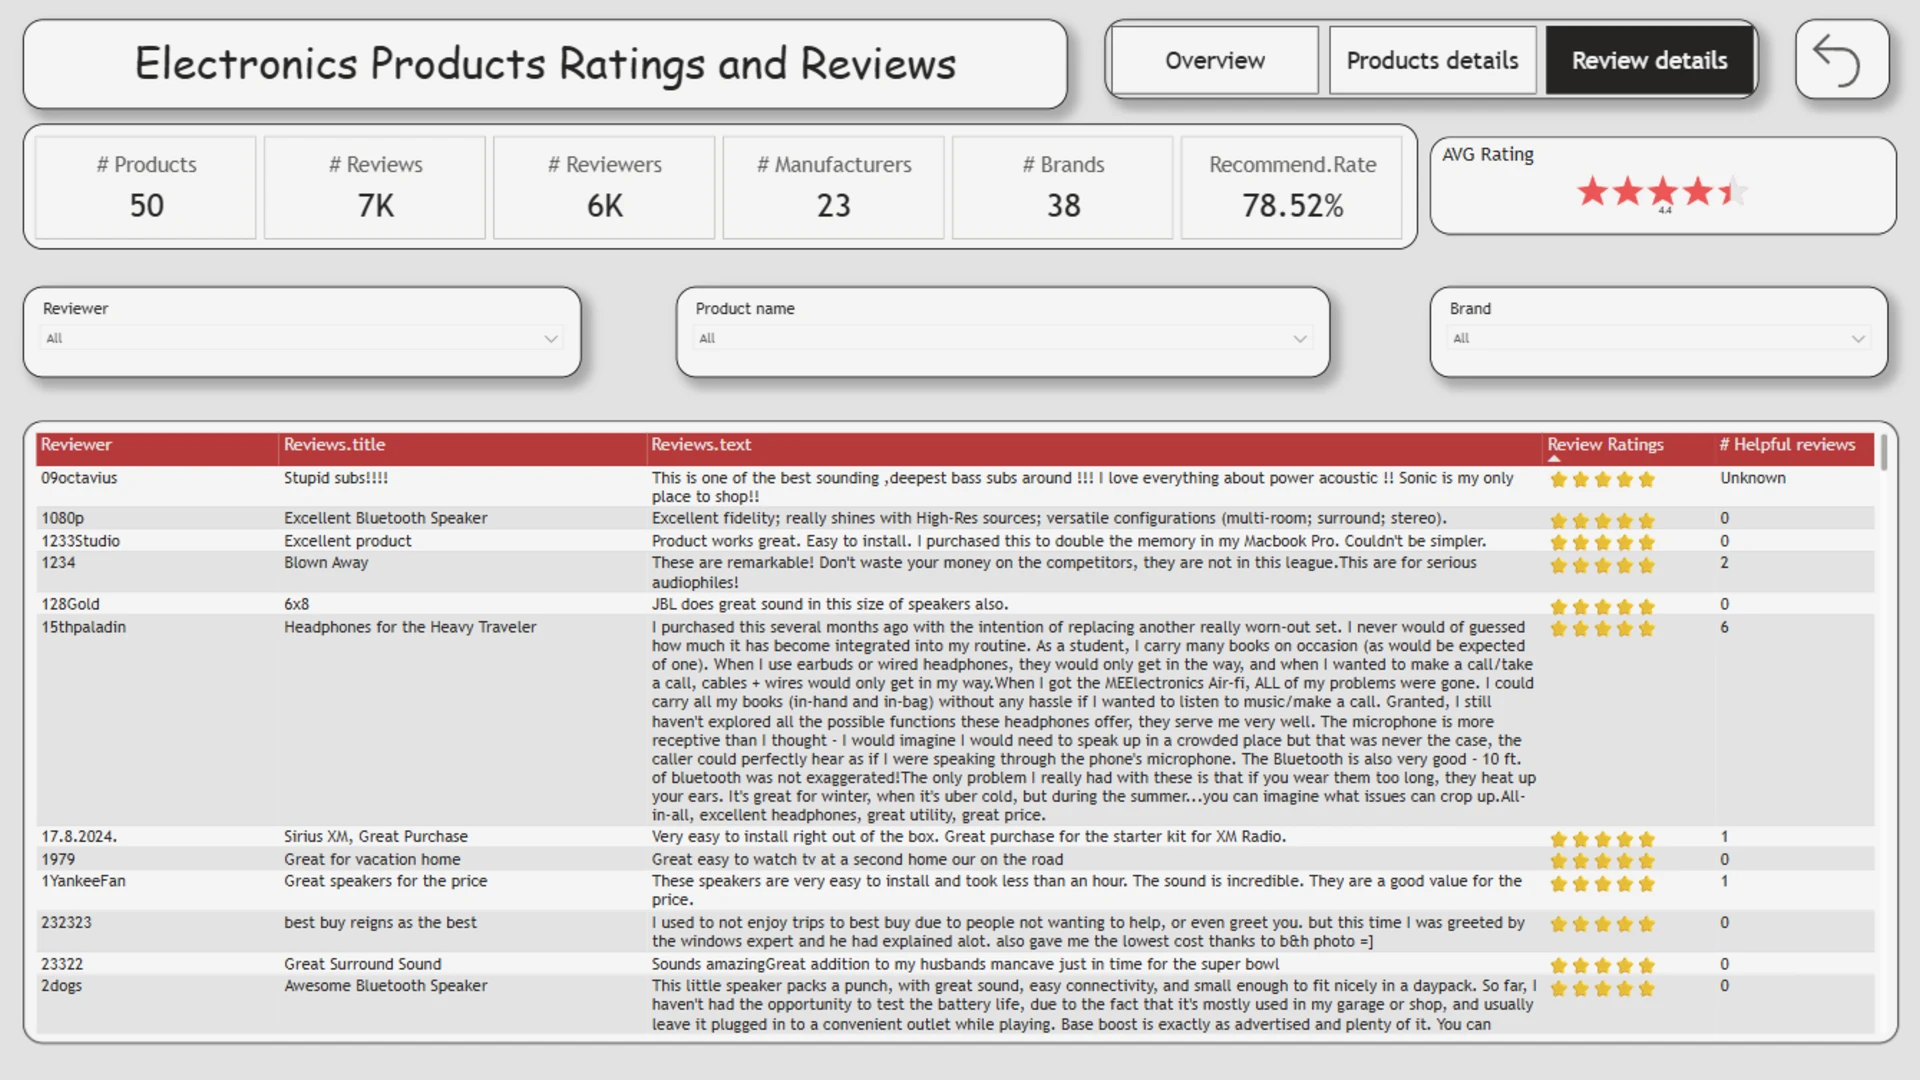
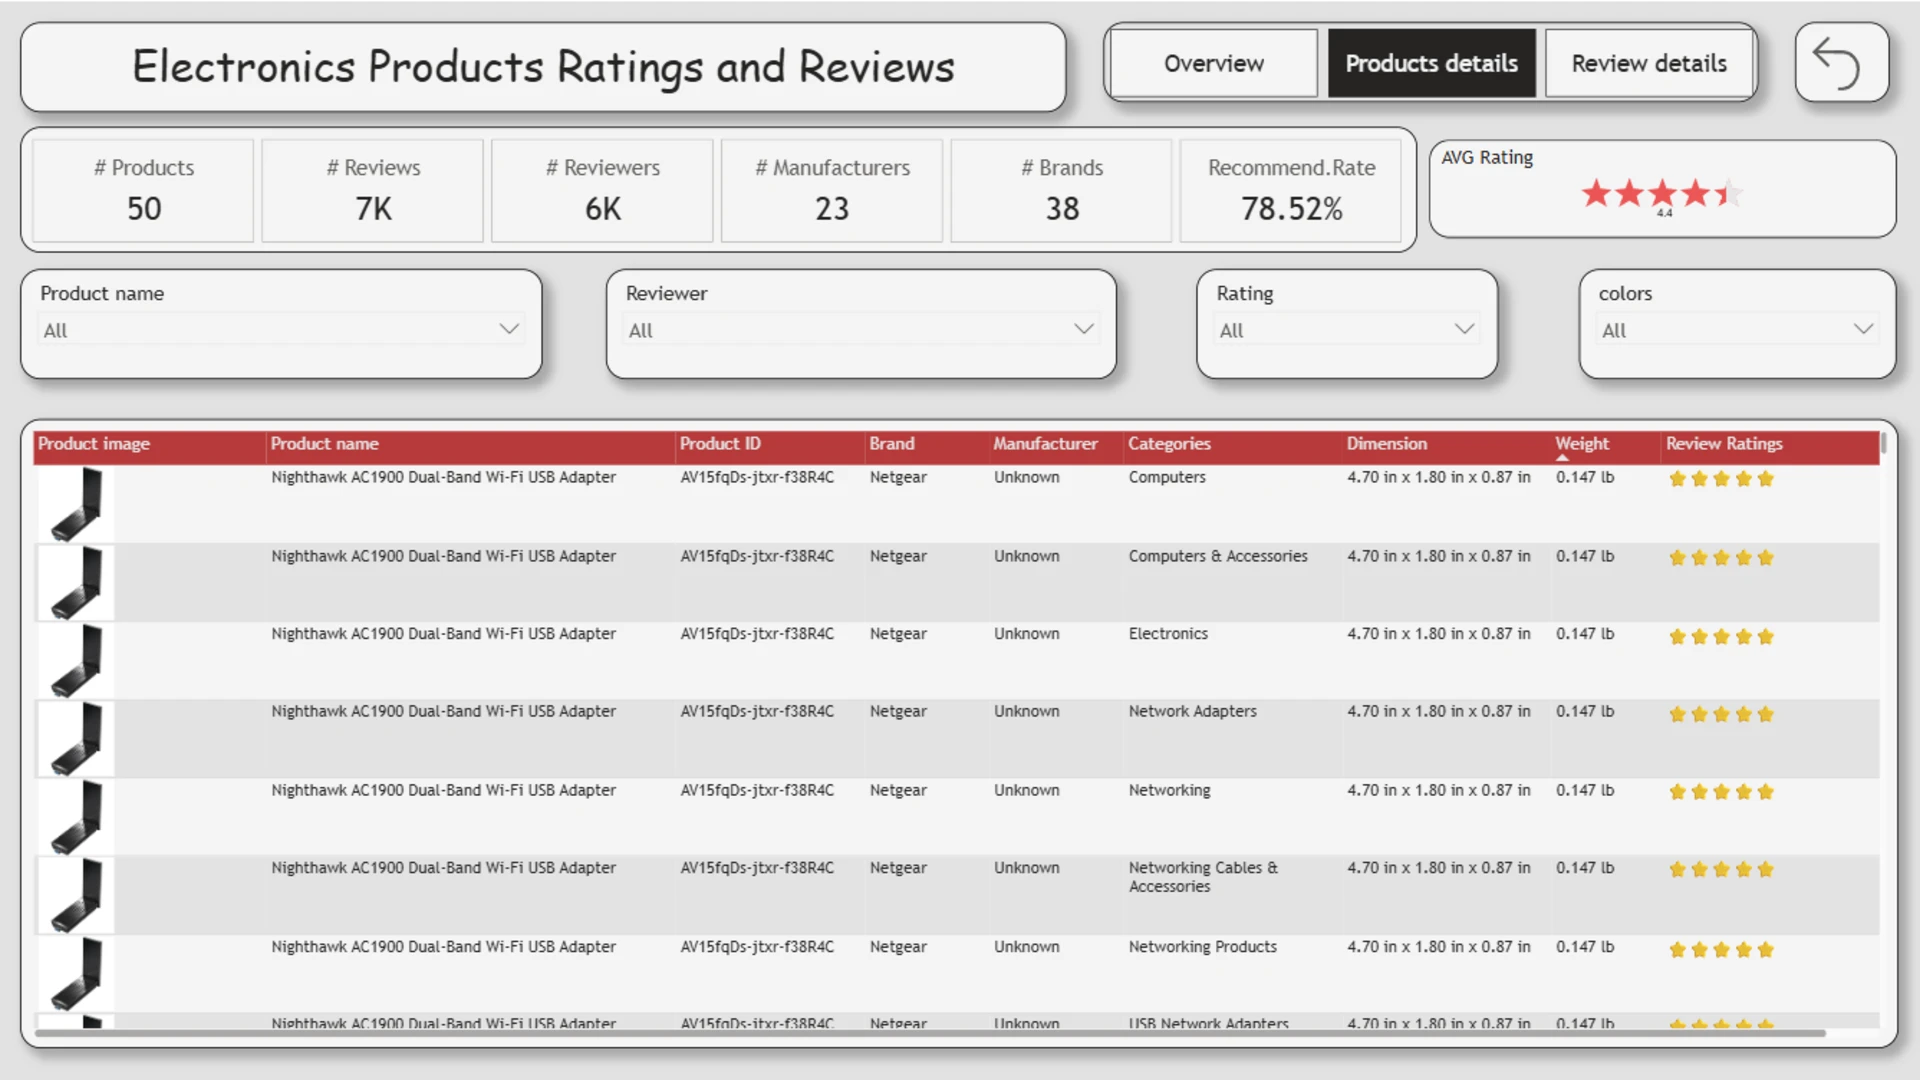
◾ On additional two pages: on Product details the users can search for specific product for more details and use the Rating slicer to find the best or worst performing products according to customers. On the Reviews details page the users can find reviews for specific product/brand and all the comments from the customers. Most of the time the title of the review speaks for himself, but it's interesting to read the review text for the whole picture 😉



4U Report Challenges
Participate in data challenges, build and submit reports to get free template downloads.
Join CommunityMobile view allows you to interact with the report. To Download the template please switch to desktop view.
How to use a PBIX template
Preview the interactive report, download the PBIX file, open it in Power BI Desktop, and replace the same data connection with your own dataset.
Preview and download
Explore the report online and download the PBIX template file.
Open in Power BI Desktop
Open the downloaded PBIX file in Power BI Desktop.
Connect your data
Replace the sample data source with your own dataset.
Refresh and adjust
Refresh the model and update fields or visual were needed.
Save and share
Save your report and publish it for your audience.


