1383
Education Analytics Power BI Report
Education Analytics Power BI Report
More Report pages
Report Author: Mohammed Mirzan
1383
Share template with others
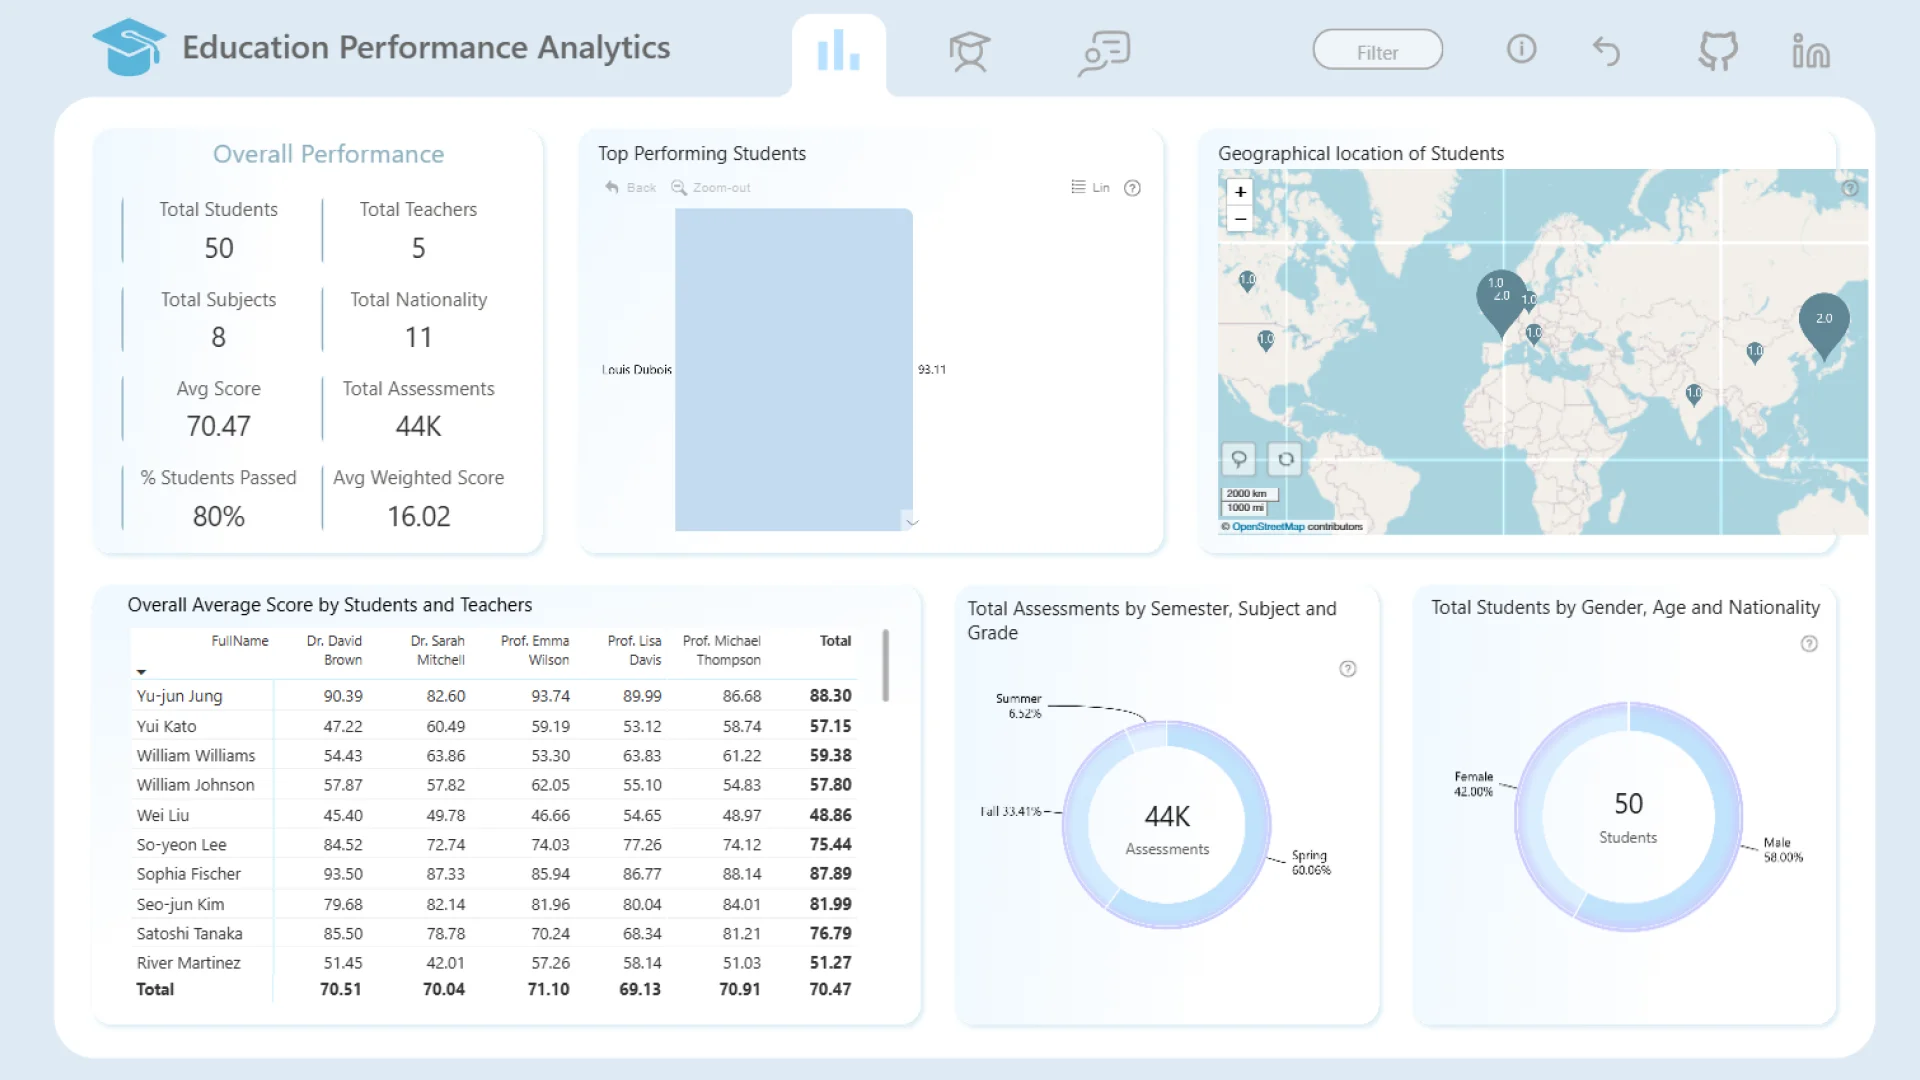
This Power BI report uses the Education/Student Performance dataset and features ZoomCharts Drill Down PRO custom visuals for Power BI. It was submitted to the FP20 Analytics ZoomCharts Data Challenge 31 in October 2025.
Author Description:
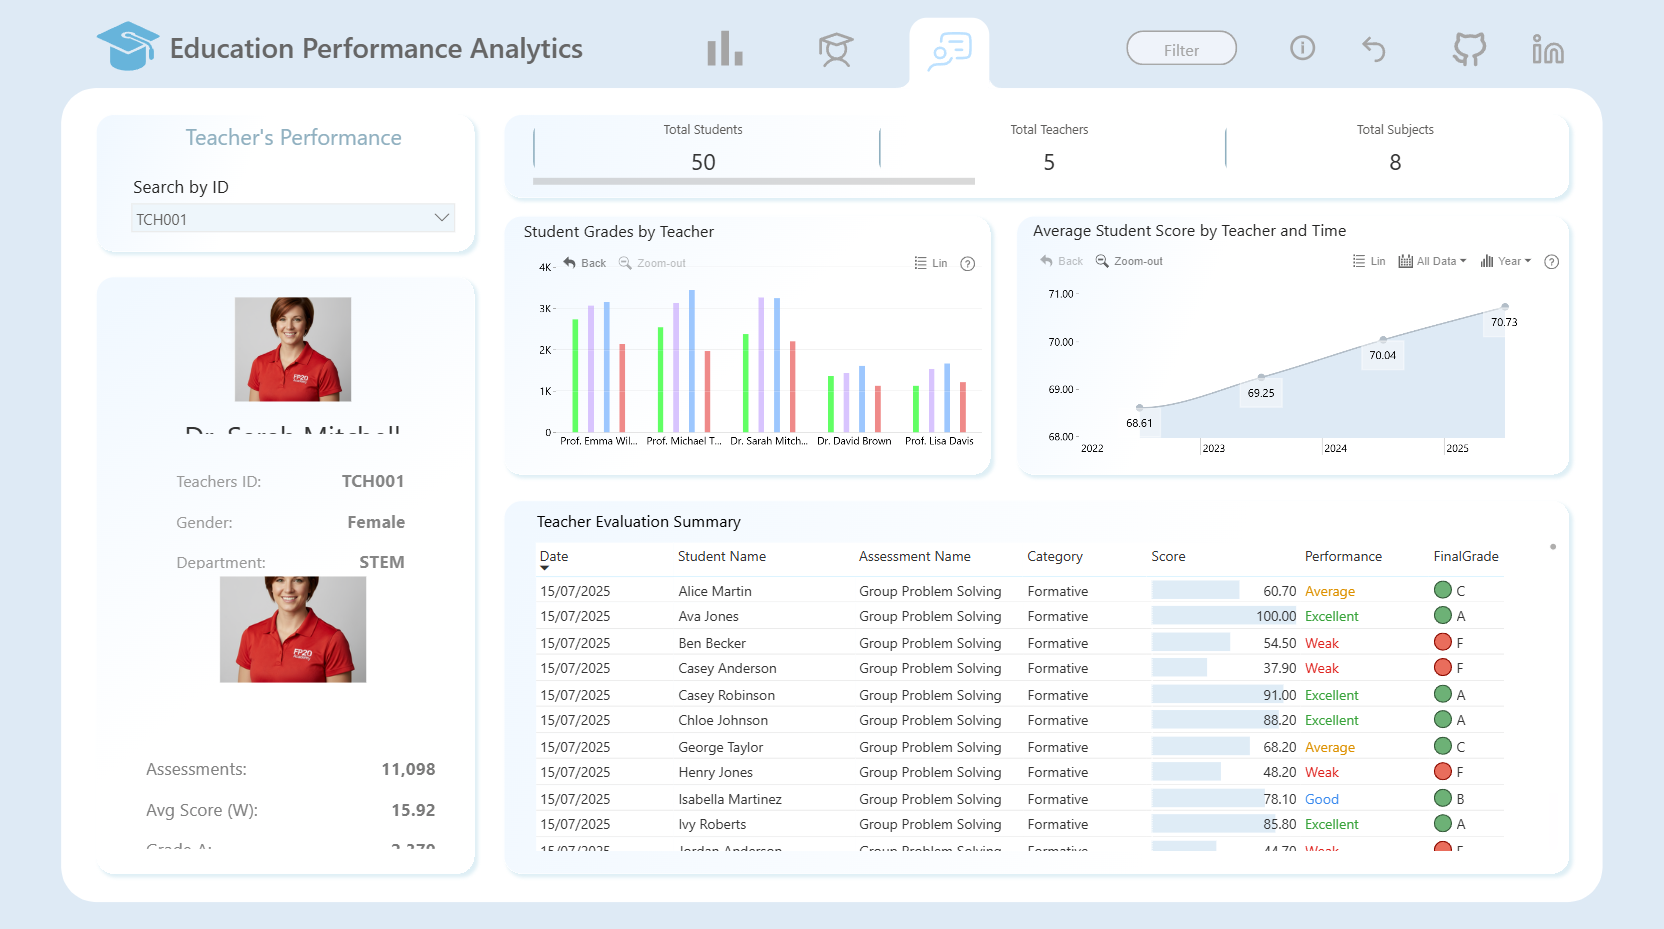
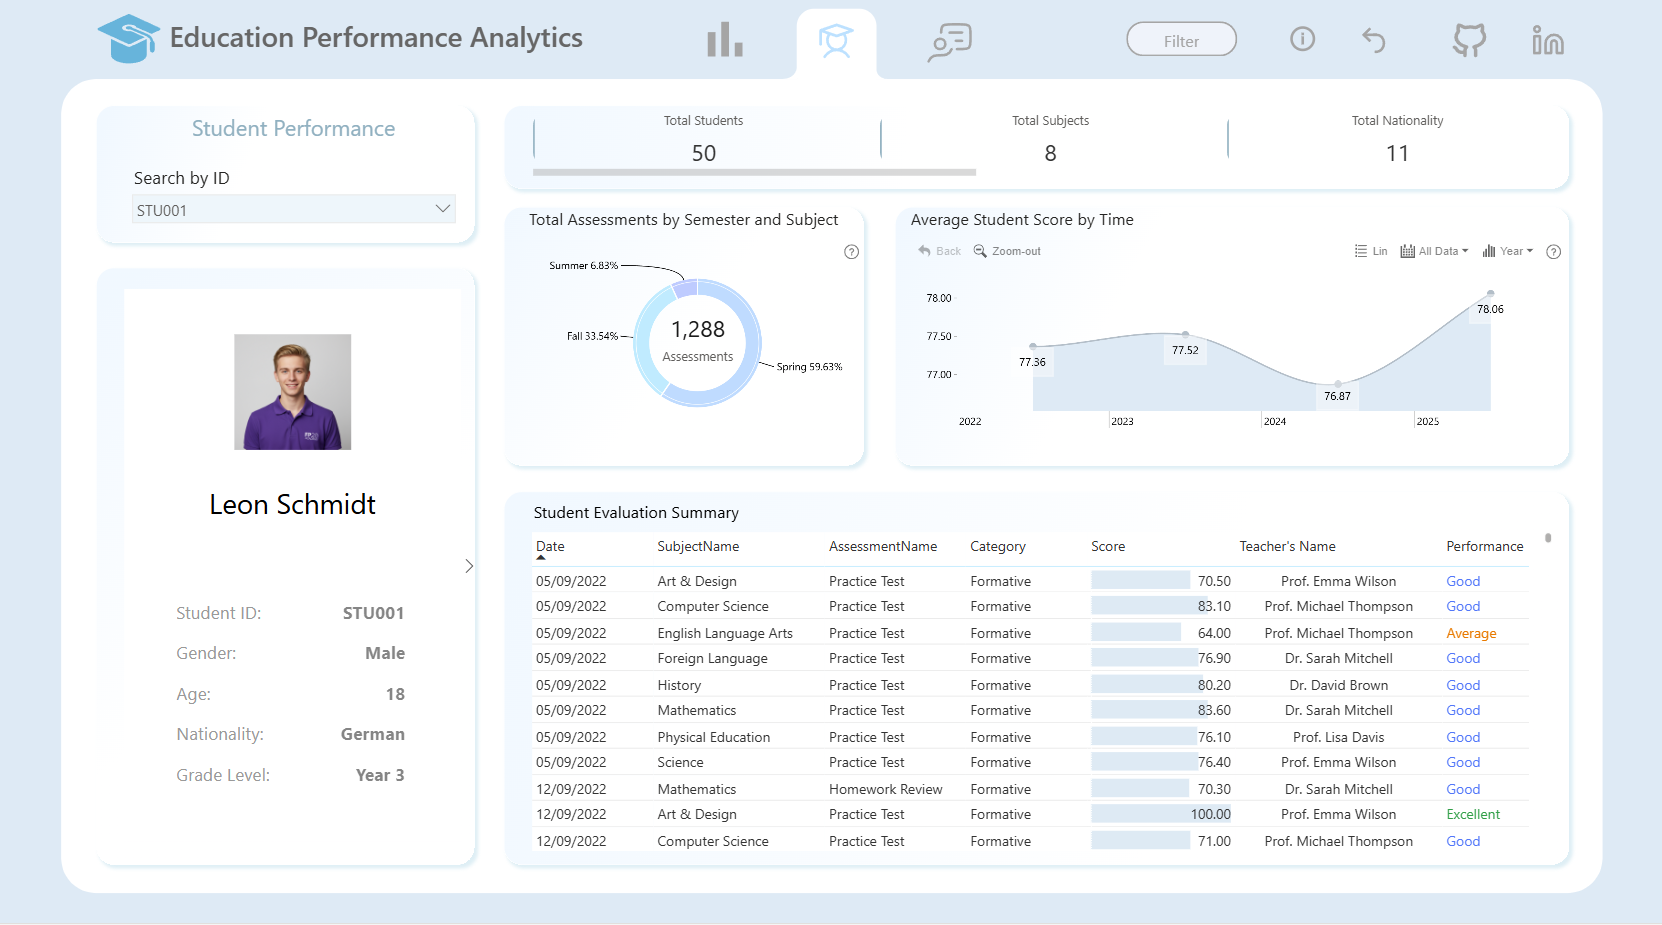
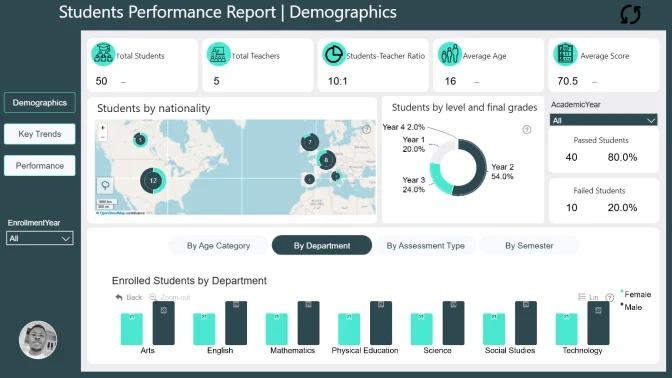
Analyze student performance data to uncover insights that improve learning outcomes, teaching effectiveness, and institutional decision-making. This challenge focuses on using data to support students, empower teachers, and enhance overall academic performance.
ZoomCharts visuals used
4U Report Challenges
Participate in data challenges, build and submit reports to get free template downloads.
Join CommunityMobile view allows you to interact with the report. To Download the template please switch to desktop view.
Was this helpful? Thank you for your feedback!
Sorry about that.
How can we improve it?