672
E-Commerce Sales Report 2
E-Commerce Sales Report 2
More Report pages
Report Author: Sharon Nwajiaku
672
Share template with others
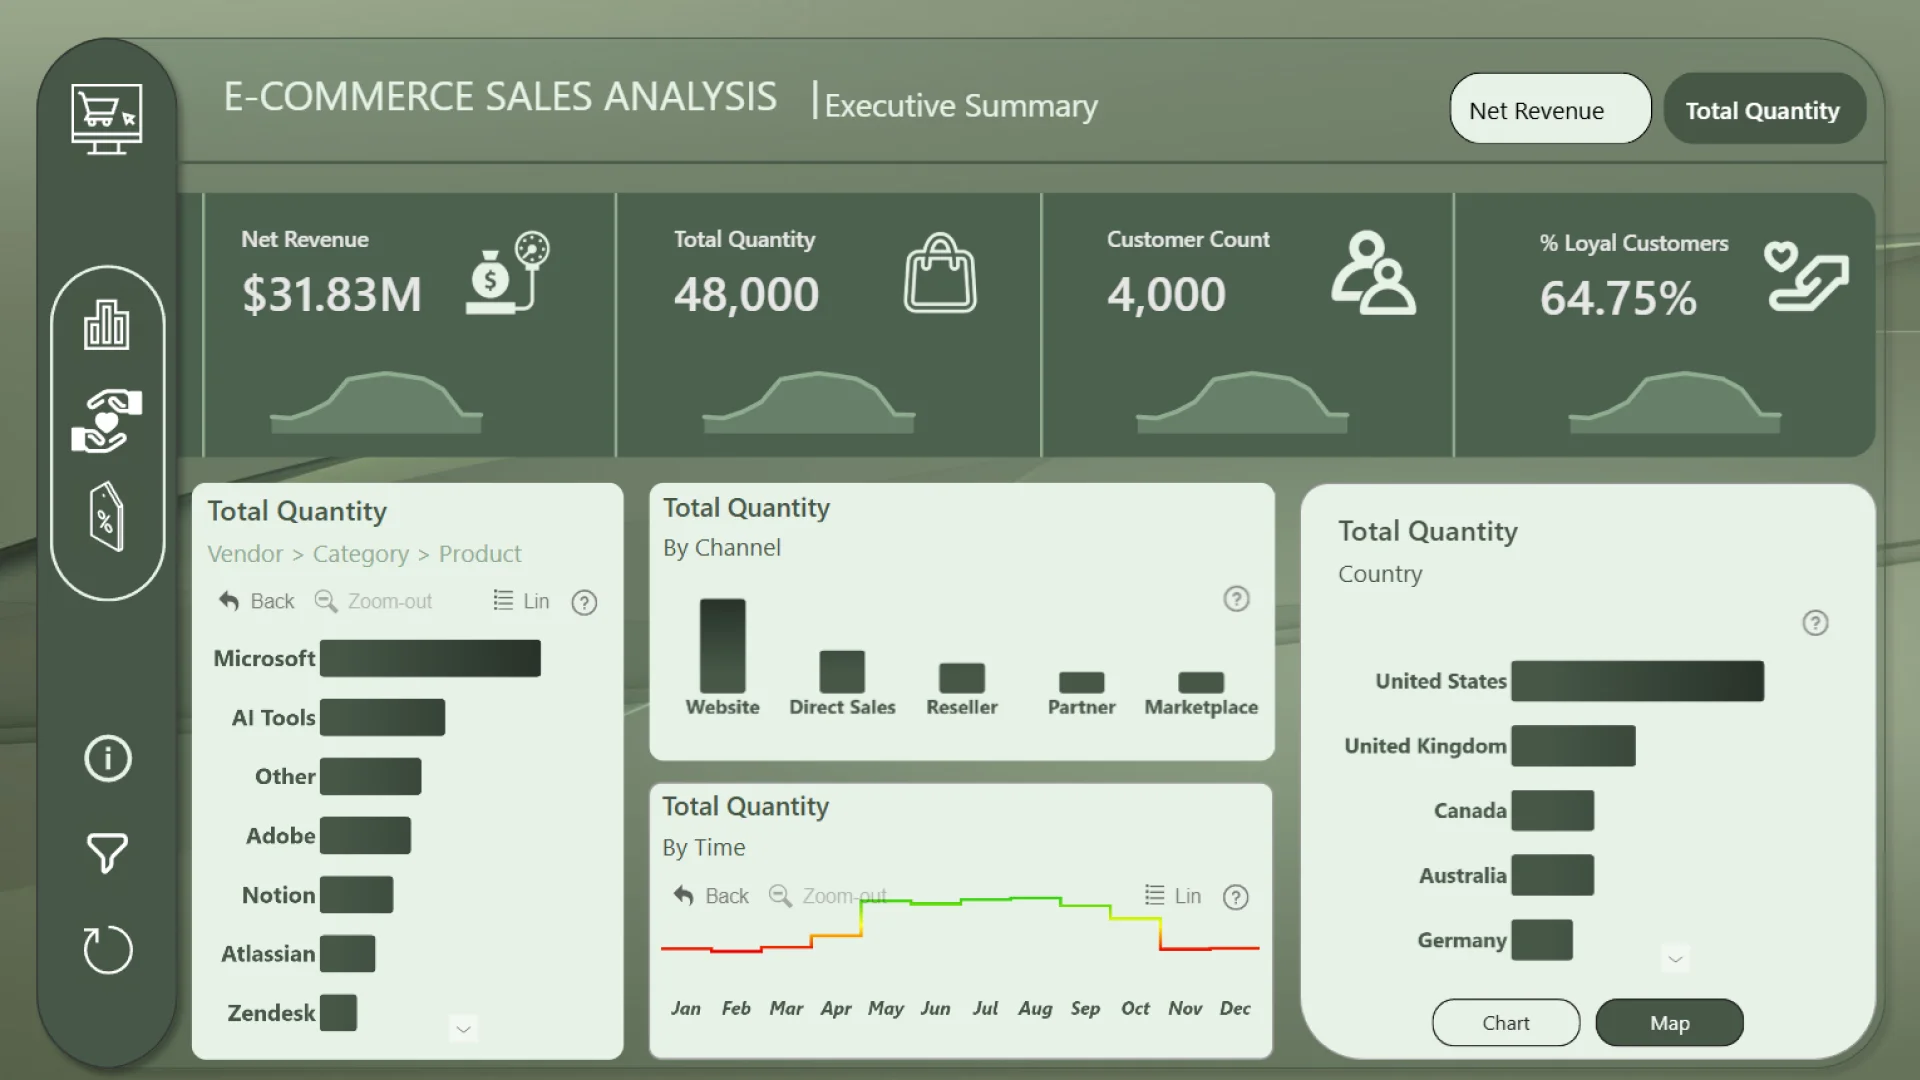
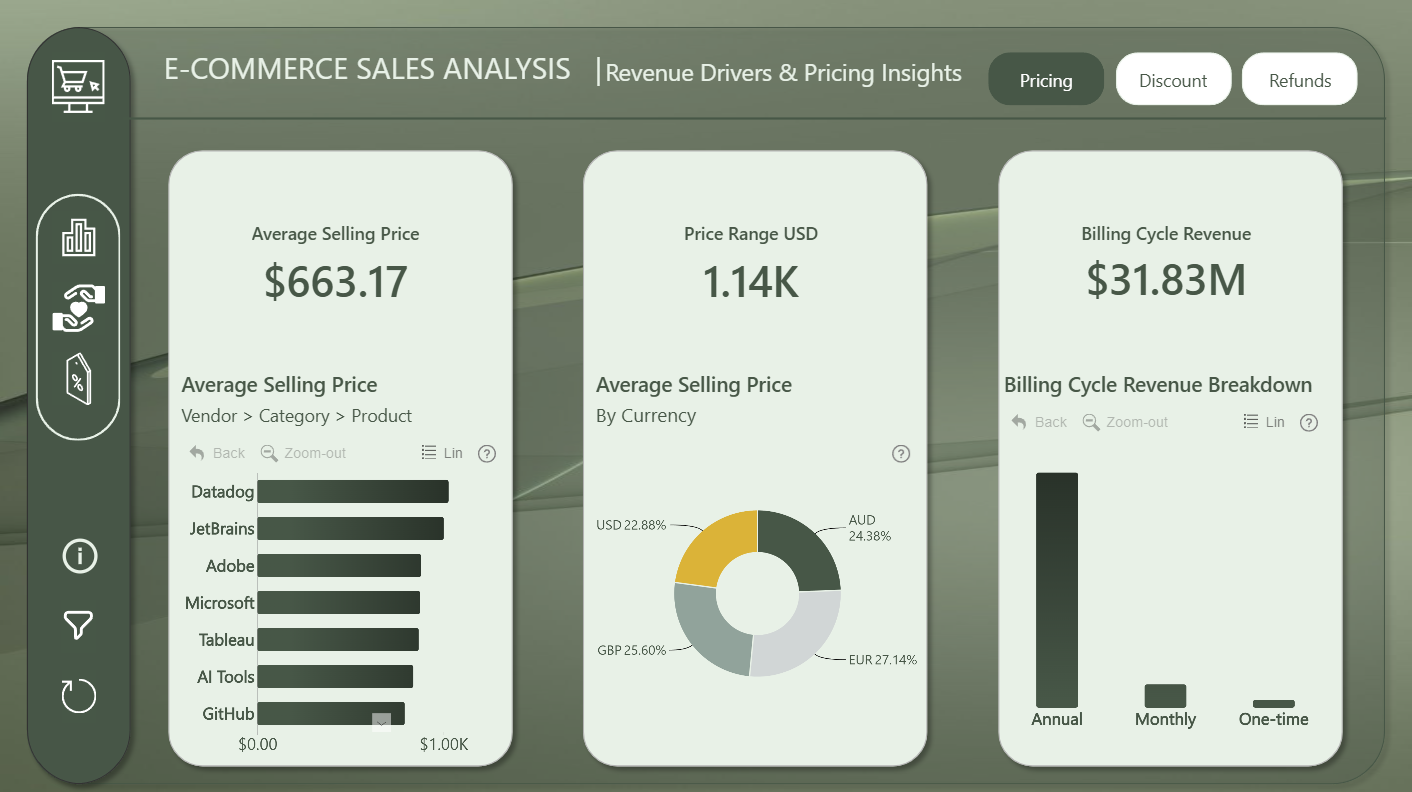
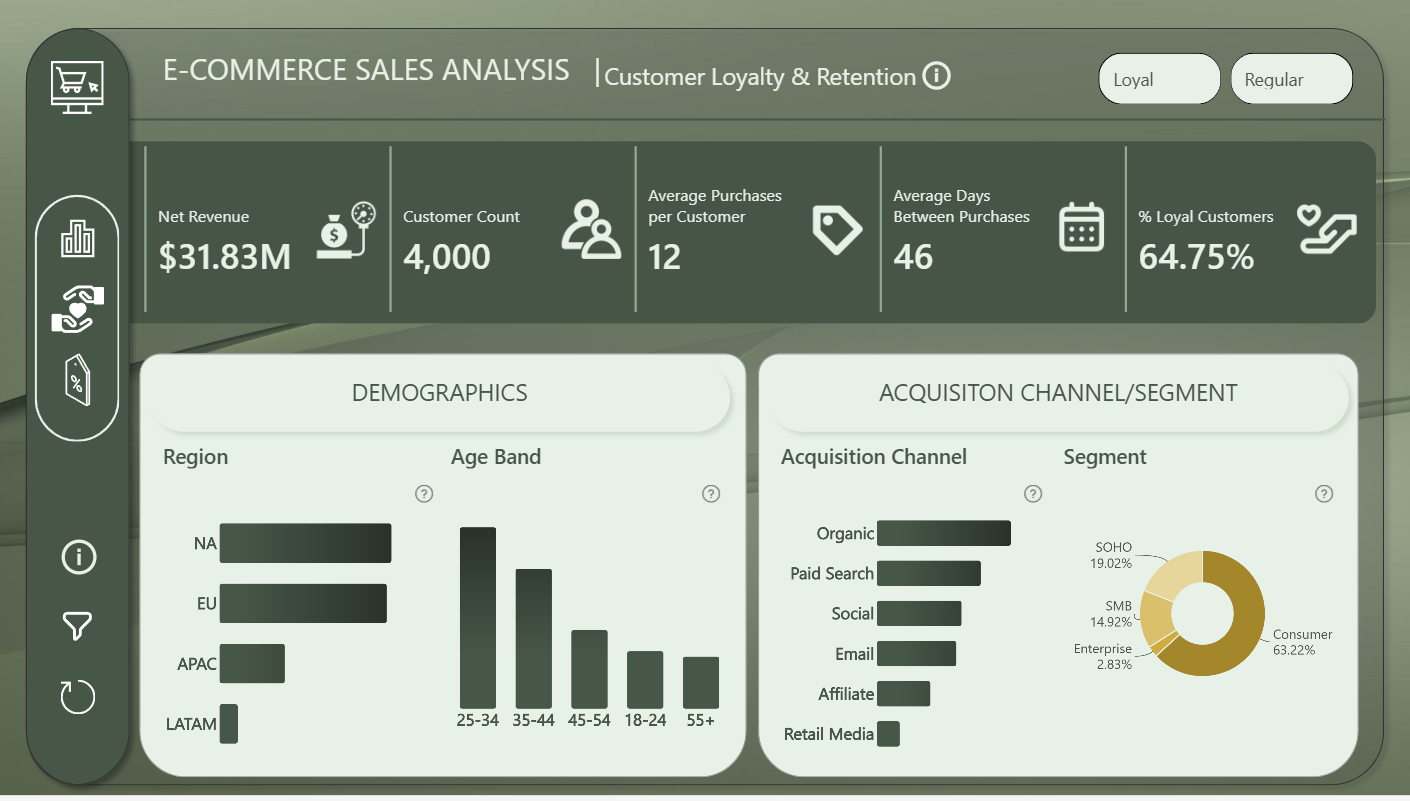
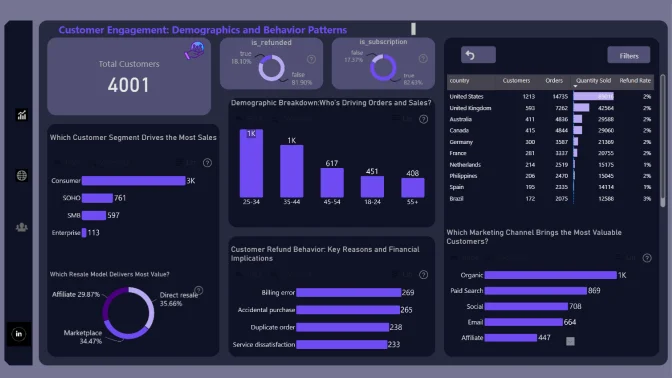
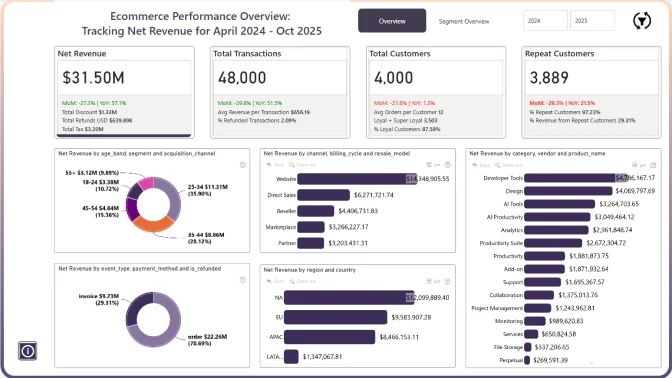
This Power BI report uses the e-commerce sales dataset from a global software retailer that sells subscriptions and add-ons across analytics, design, collaboration, and AI. The report features ZoomCharts Drill Down PRO custom visuals for Power BI. It was submitted to the Onyx Data DataDNA ZoomCharts Mini Challenge in October 2025.
Author description:
This interactive E-Commerce Sales Analysis dashboard tracks over $31M in revenue, providing deep dives into customer loyalty, regional demographics, and the financial impact of pricing strategies.
4U Report Challenges
Participate in data challenges, build and submit reports to get free template downloads.
Join CommunityMobile view allows you to interact with the report. To Download the template please switch to desktop view.

Was this helpful? Thank you for your feedback!
Sorry about that.
How can we improve it?