1194
E-Commerce Sales Analytics 2
E-Commerce Sales Analytics 2
More Report pages
Report Author: Crystal Andrea Dsouza
1194
Share template with others
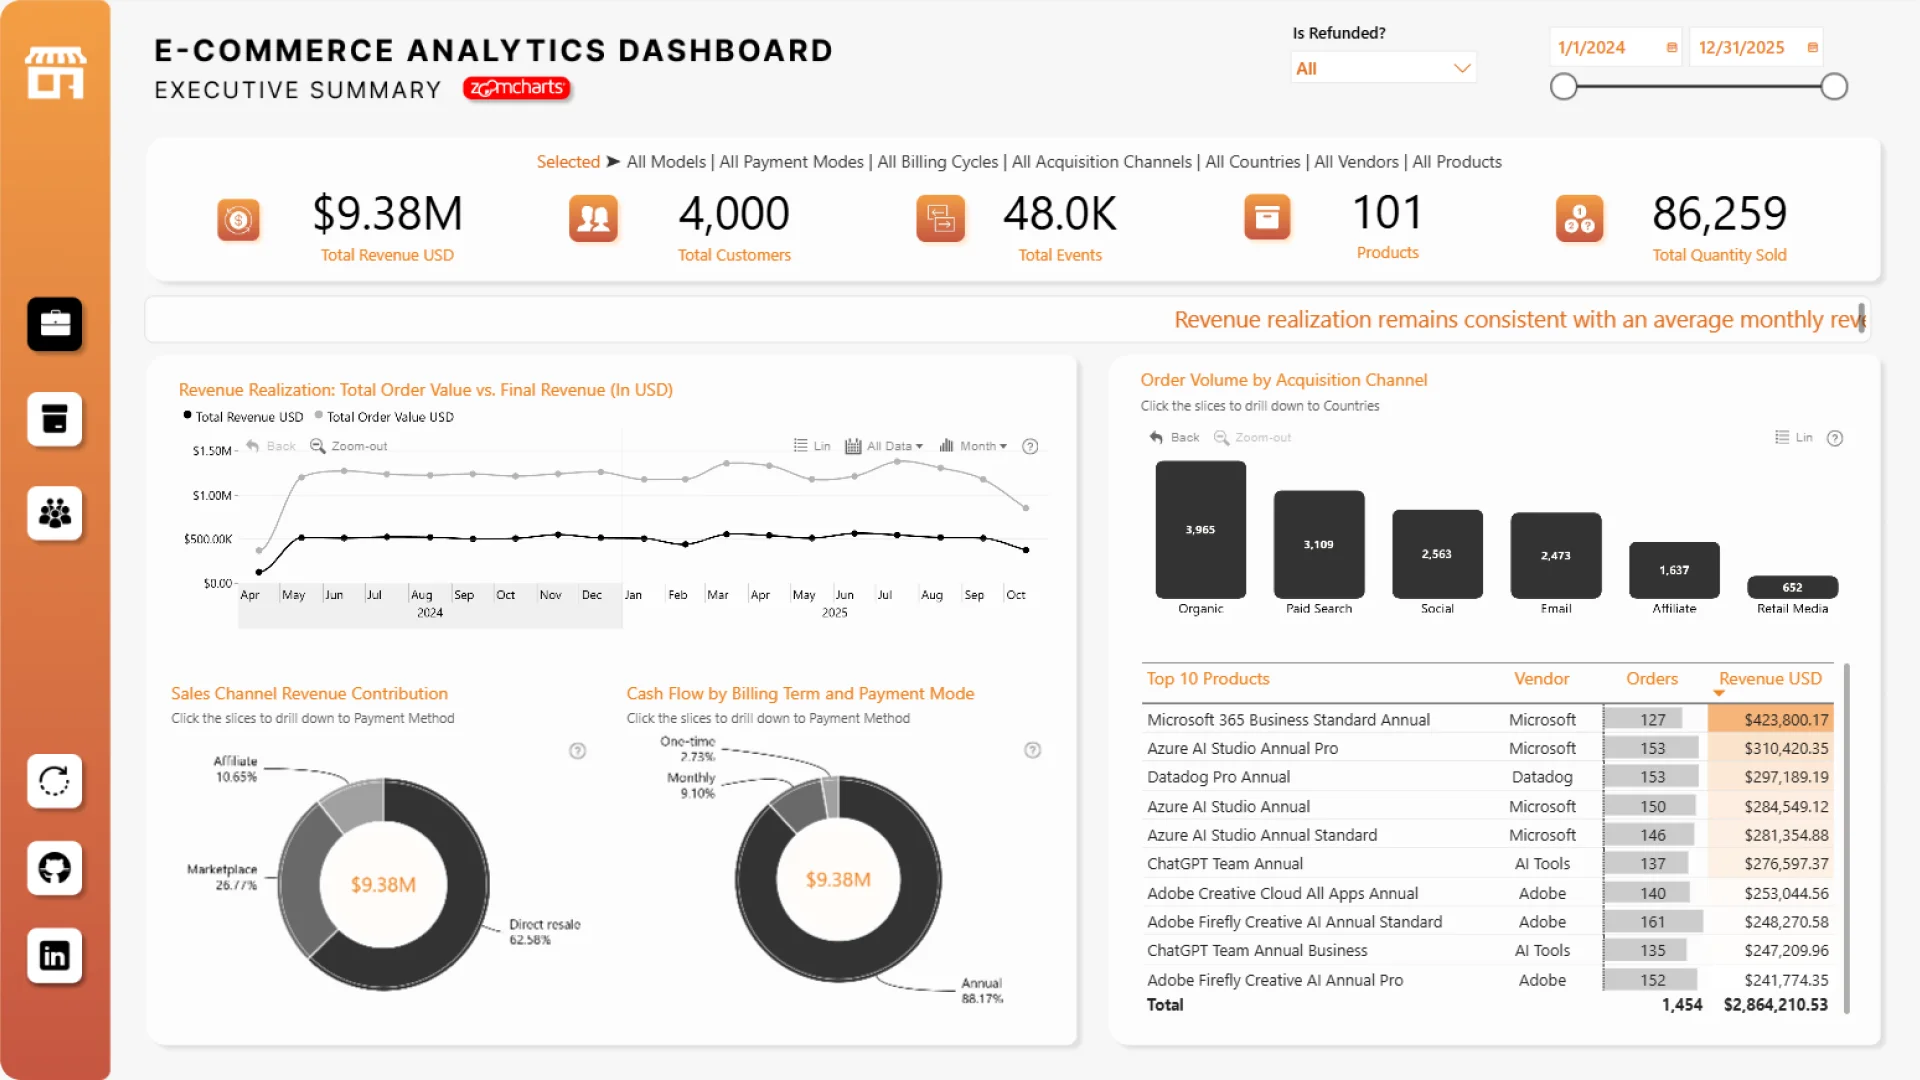
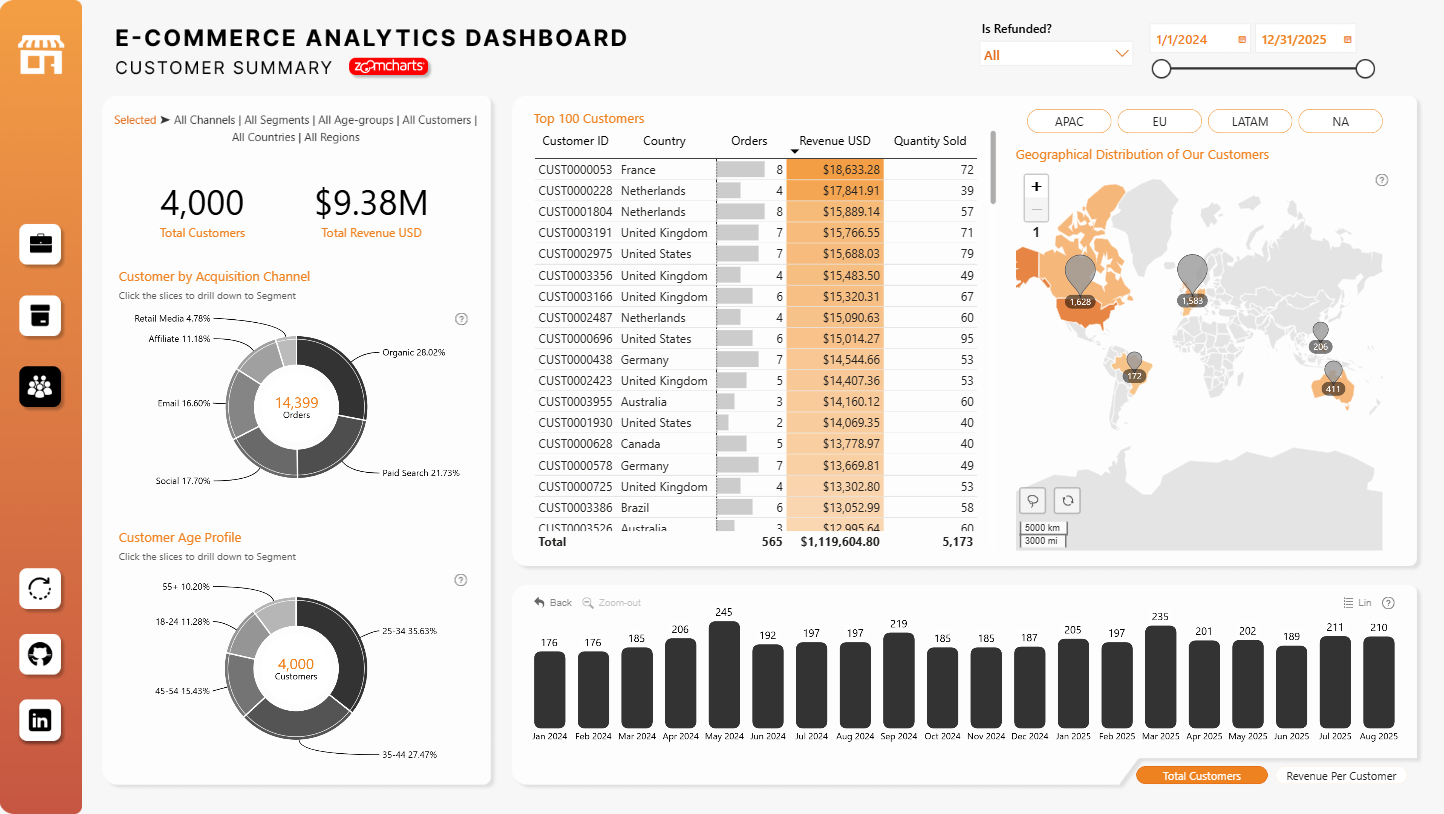
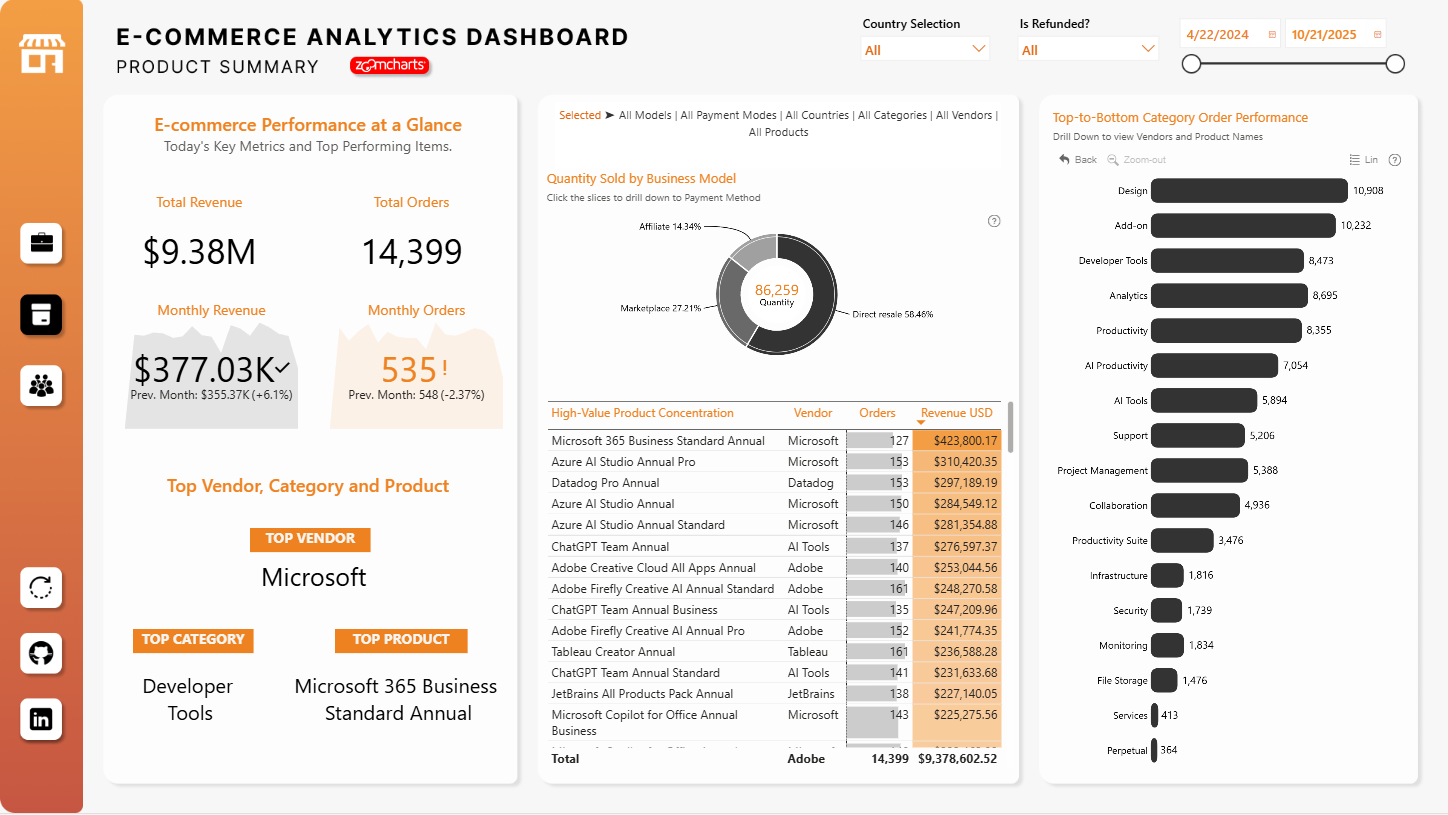
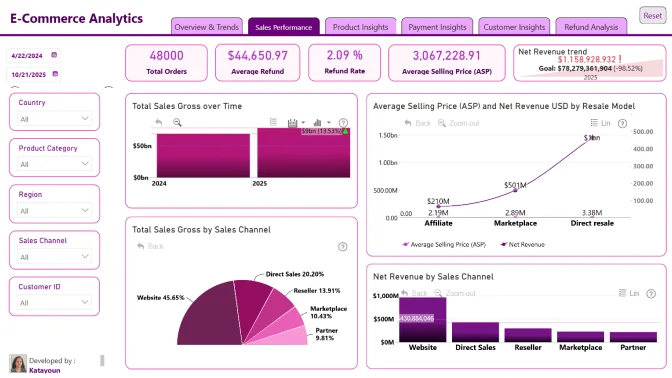
This Power BI report uses the e-commerce sales dataset from a global software retailer that sells subscriptions and add-ons across analytics, design, collaboration, and AI. The report features ZoomCharts Drill Down PRO custom visuals for Power BI. It was submitted to the Onyx Data DataDNA ZoomCharts Mini Challenge in October 2025.
Author description:
This E-Commerce Analytics Dashboard was created for the ZoomCharts November 2025 Mini Challenge, using fully interactive ZoomCharts visuals to analyze sales, product, and customer performance. Designed with a modern e-commerce theme, the dashboard highlights revenue realization, billing models, order trends, and top-performing products while enabling seamless drill-down exploration across all visuals. A unique feature of this report is the floating HTML ticker, which continuously displays live insights and performance highlights, adding a dynamic storytelling element. The combination of Power BI, DAX, ZoomCharts, and Figma helped bring together interactivity, design, and analytics into one cohesive dashboard experience.
ZoomCharts visuals used





4U Report Challenges
Participate in data challenges, build and submit reports to get free template downloads.
Join CommunityMobile view allows you to interact with the report. To Download the template please switch to desktop view.
How to use a PBIX template
Preview the interactive report, download the PBIX file, open it in Power BI Desktop, and replace the same data connection with your own dataset.
Preview and download
Explore the report online and download the PBIX template file.
Open in Power BI Desktop
Open the downloaded PBIX file in Power BI Desktop.
Connect your data
Replace the sample data source with your own dataset.
Refresh and adjust
Refresh the model and update fields or visual were needed.
Save and share
Save your report and publish it for your audience.


