952
E-Commerce Sales Analytics 16
E-Commerce Sales Analytics 16
More Report pages
Report Author: Nadia Du
952
Share template with others
This Power BI report uses the e-commerce sales dataset from a global software retailer that sells subscriptions and add-ons across analytics, design, collaboration, and AI. The report features ZoomCharts Drill Down PRO custom visuals for Power BI. It was submitted to the Onyx Data DataDNA ZoomCharts Mini Challenge in October 2025.
Author description:
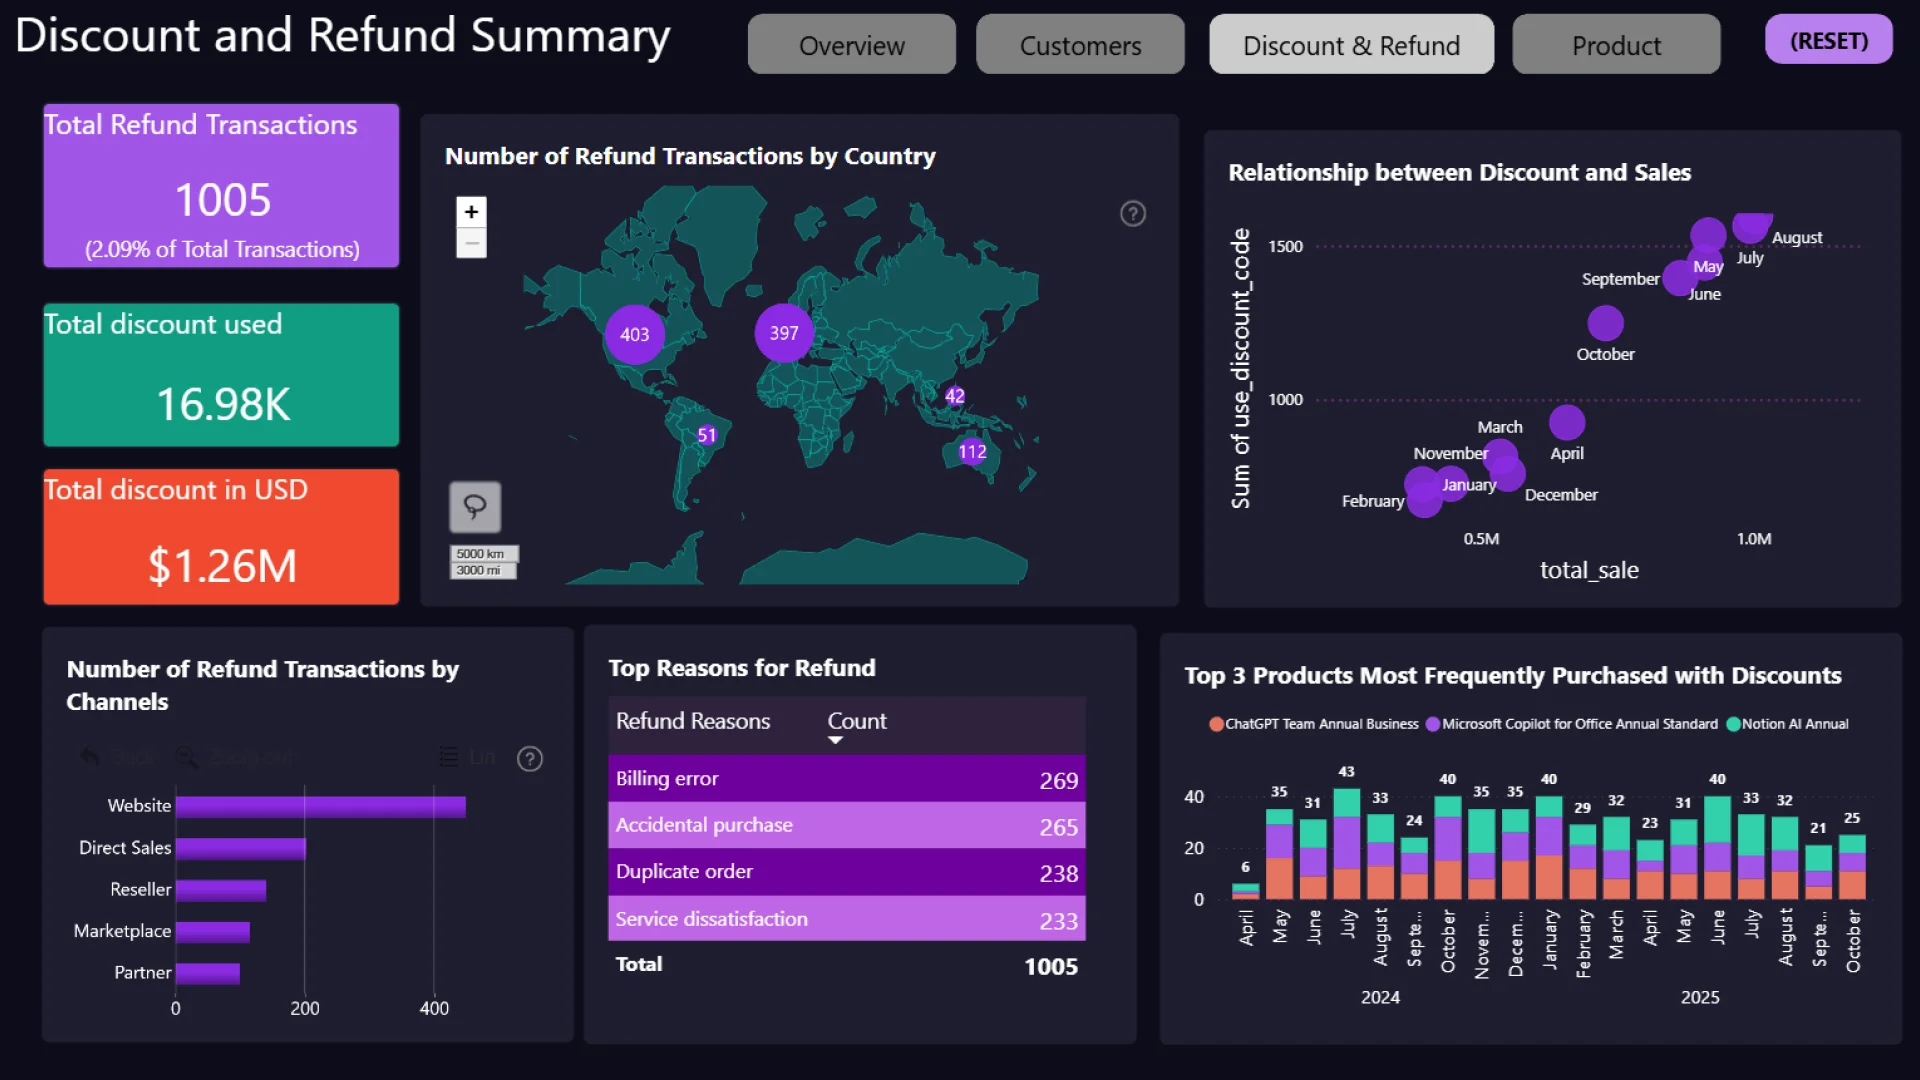
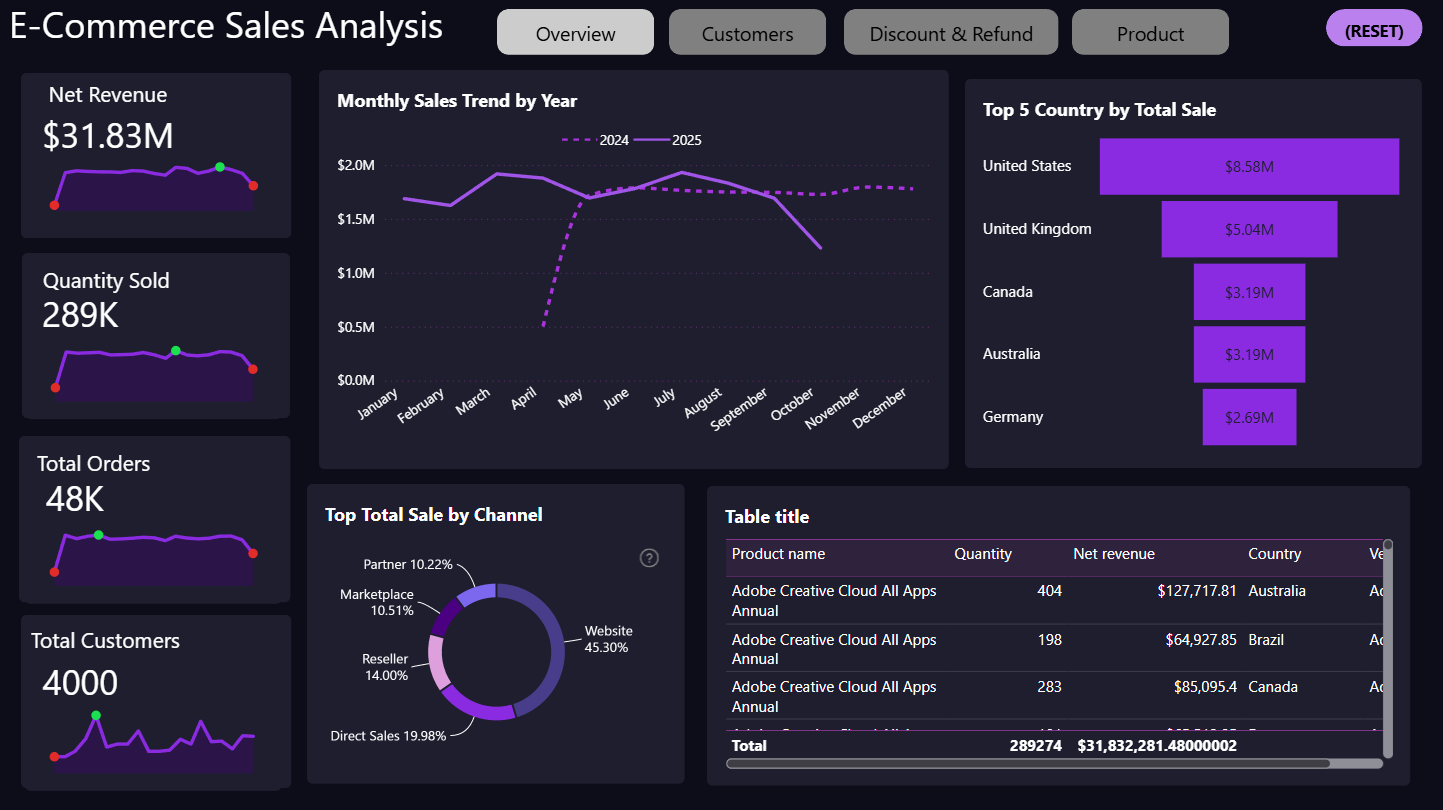
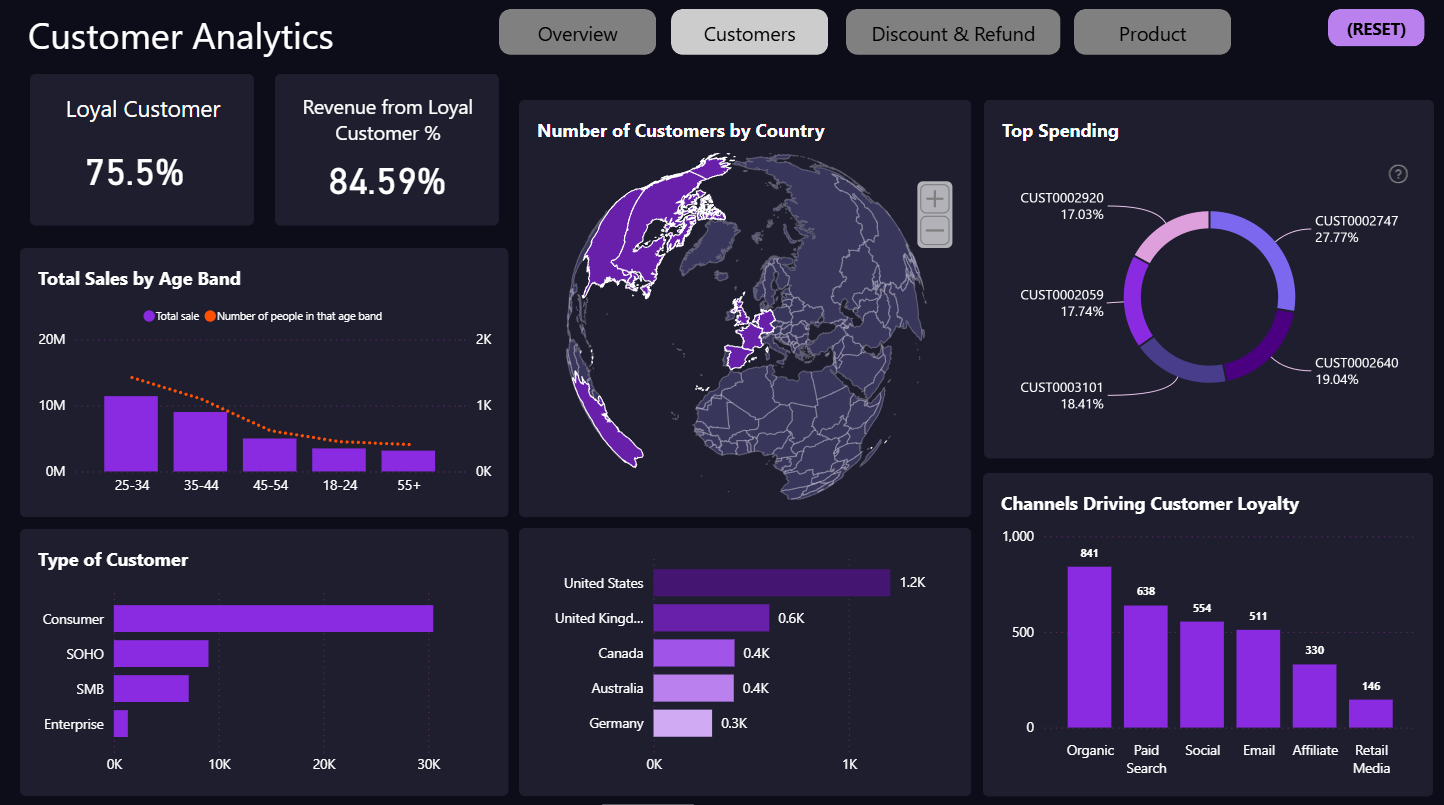
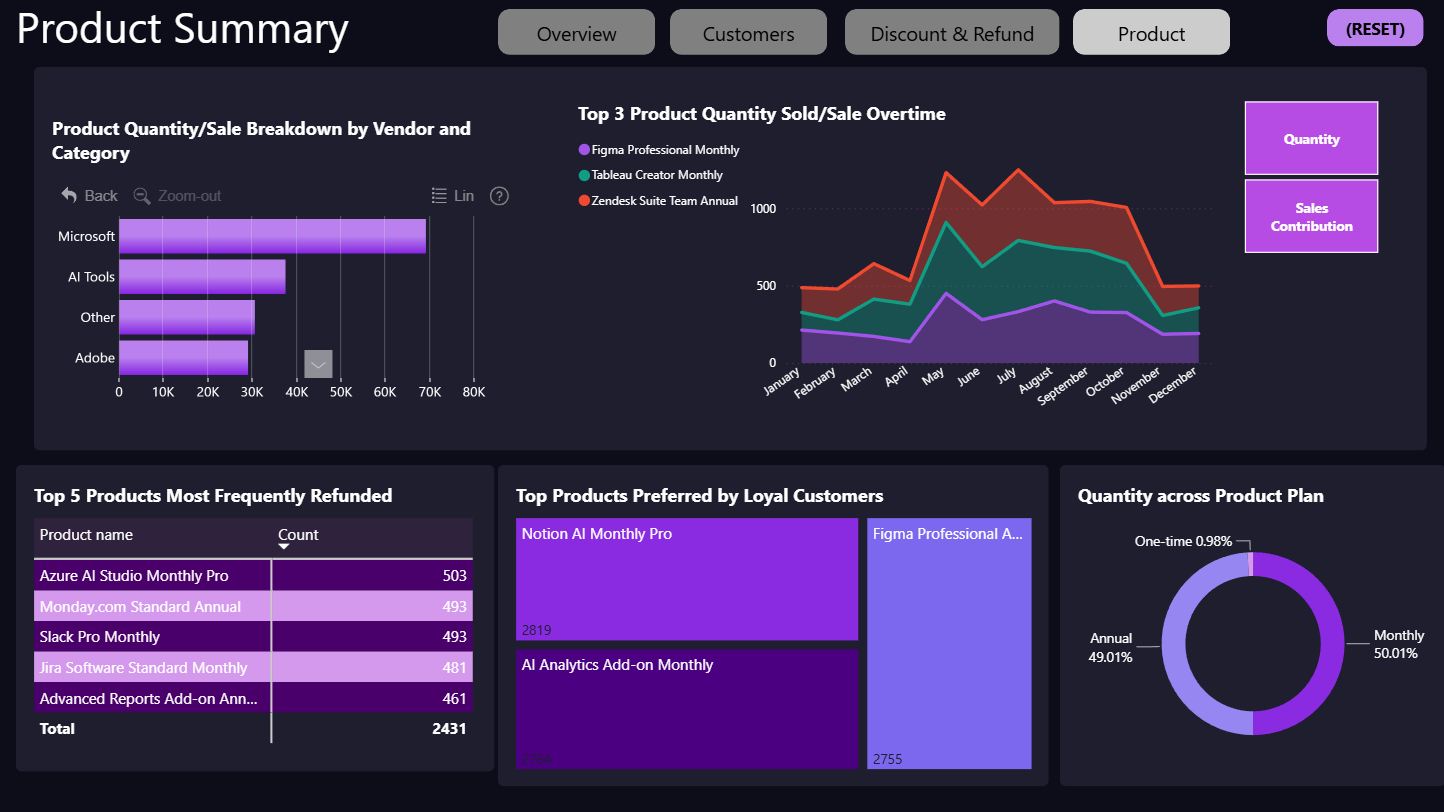
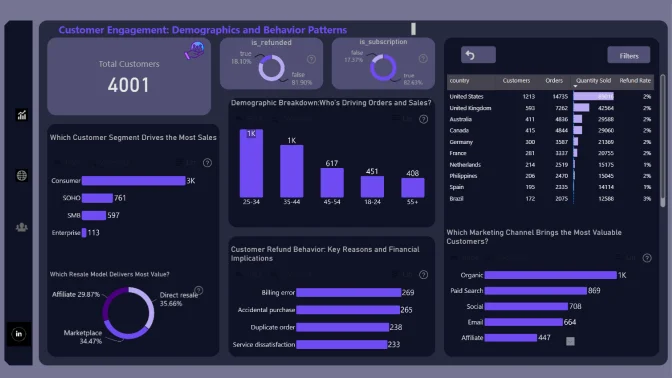
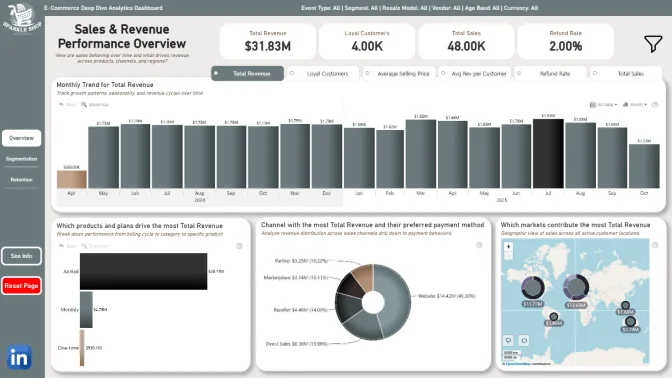
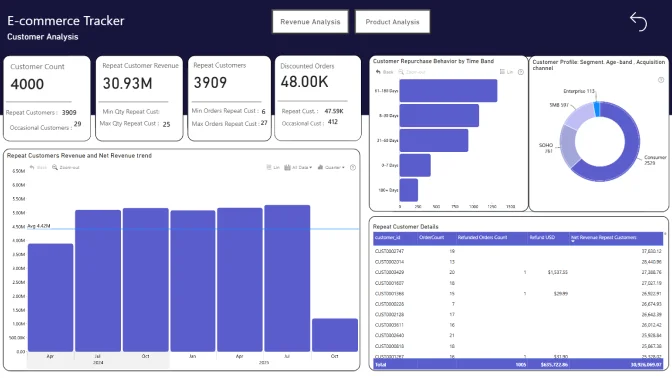
I built an E-commerce Sales Dashboard in Power BI, divided into four sections: Overview, Customer Analysis, Discount & Refund Analysis, and Product Analysis. Some key insights I found: Sales Trends: Overall sales in 2025 are higher than 2024, except for a dip in September–October. Top Markets & Channels: The US is the largest contributor to sales. The website drives over 45% of total sales. Customer Insights: Loyal customers are the main revenue drivers. 75.5% of customers are loyal, generating 84.6% of total revenue. Customers aged 25–34 generate the most sales; sales drop after age 45. Organic search drives the most loyal customers, followed by Paid Search, Social, Email, and Affiliate. Discounts & Refunds: Only about 2% of transactions are refunded, showing strong product satisfaction. Higher discount usage seems to drive higher sales. Product Insights: Productivity and AI tools are top-selling products. Loyal customers favor Notion and AI tools, with similar purchase quantities for the top 3 items.
ZoomCharts visuals used




4U Report Challenges
Participate in data challenges, build and submit reports to get free template downloads.
Join CommunityMobile view allows you to interact with the report. To Download the template please switch to desktop view.
How to use a PBIX template
Preview the interactive report, download the PBIX file, open it in Power BI Desktop, and replace the same data connection with your own dataset.
Preview and download
Explore the report online and download the PBIX template file.
Open in Power BI Desktop
Open the downloaded PBIX file in Power BI Desktop.
Connect your data
Replace the sample data source with your own dataset.
Refresh and adjust
Refresh the model and update fields or visual were needed.
Save and share
Save your report and publish it for your audience.


