40
E-commerce Profitability Dashboard (Engine, Leaks & Action)
E-commerce Profitability Dashboard (Engine, Leaks & Action)
More Report pages
Report Author: Ines Boulbir
40
Share template with others
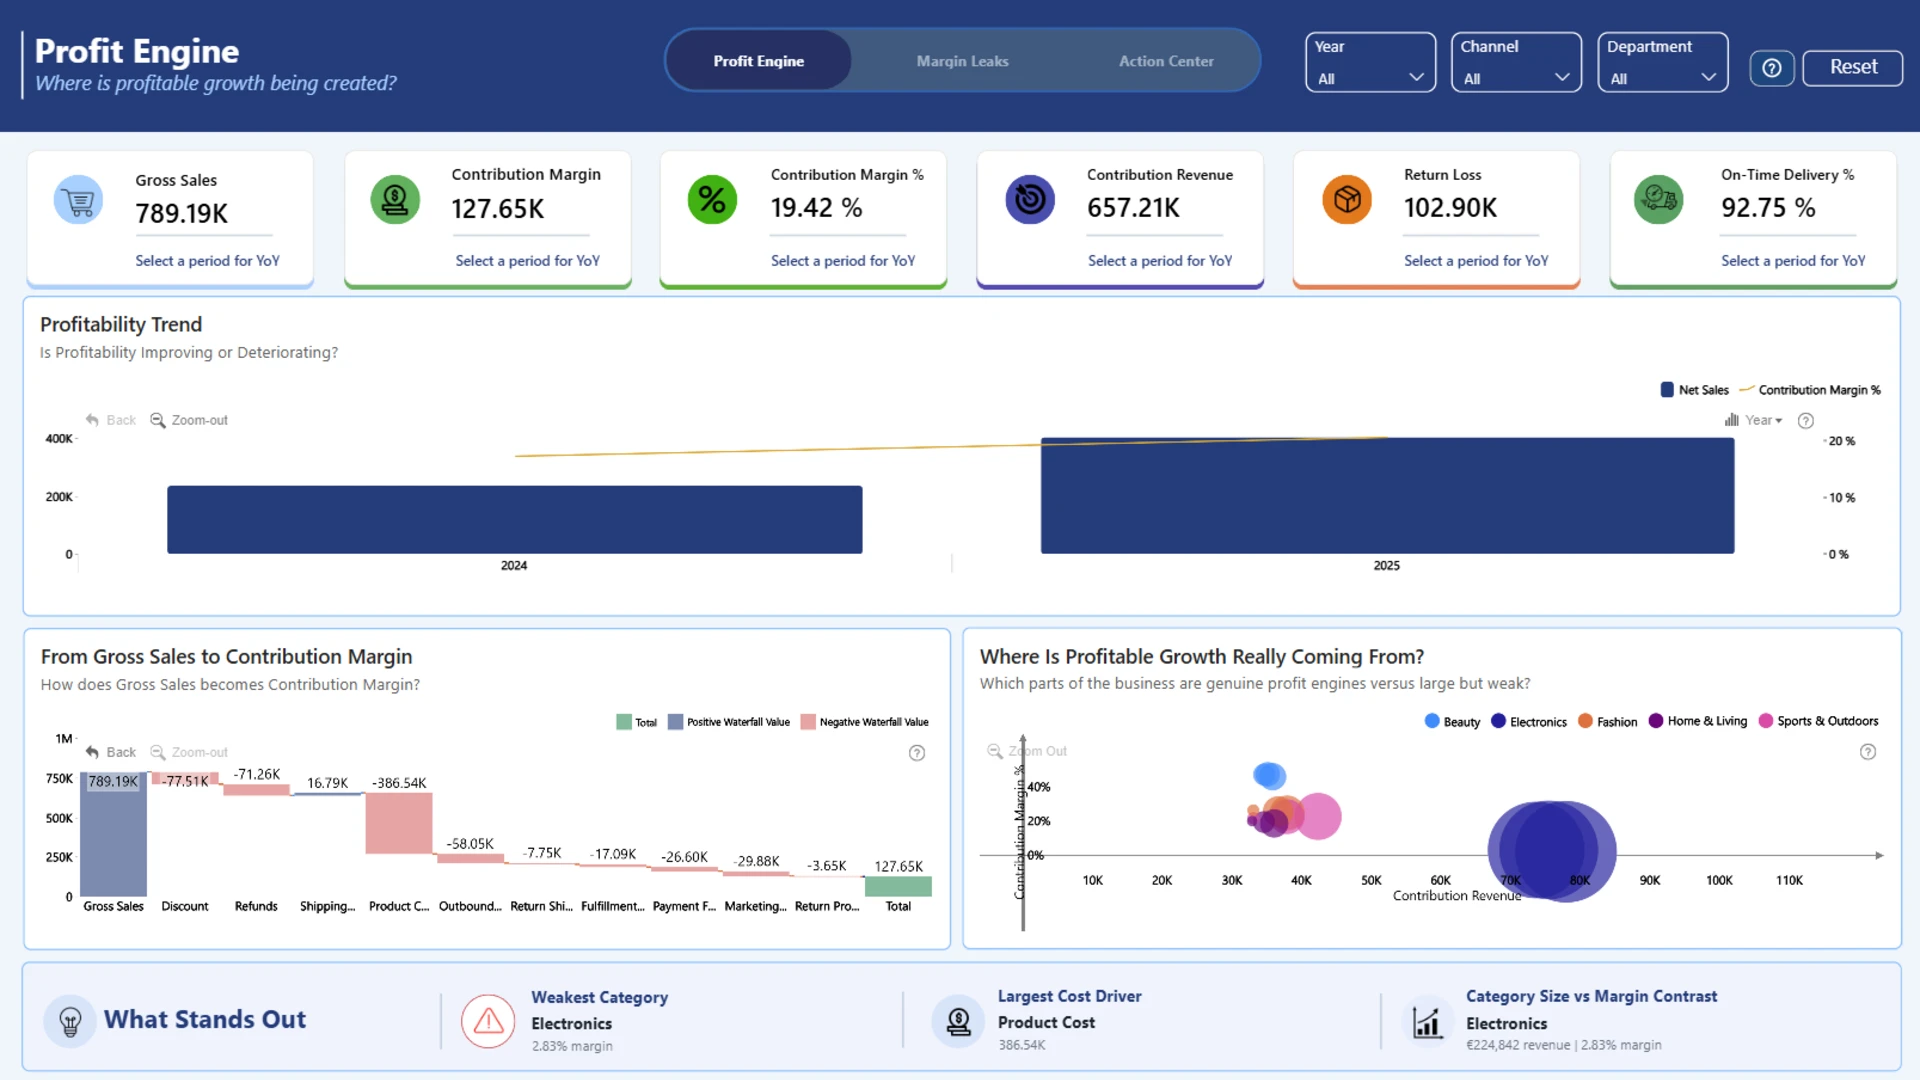
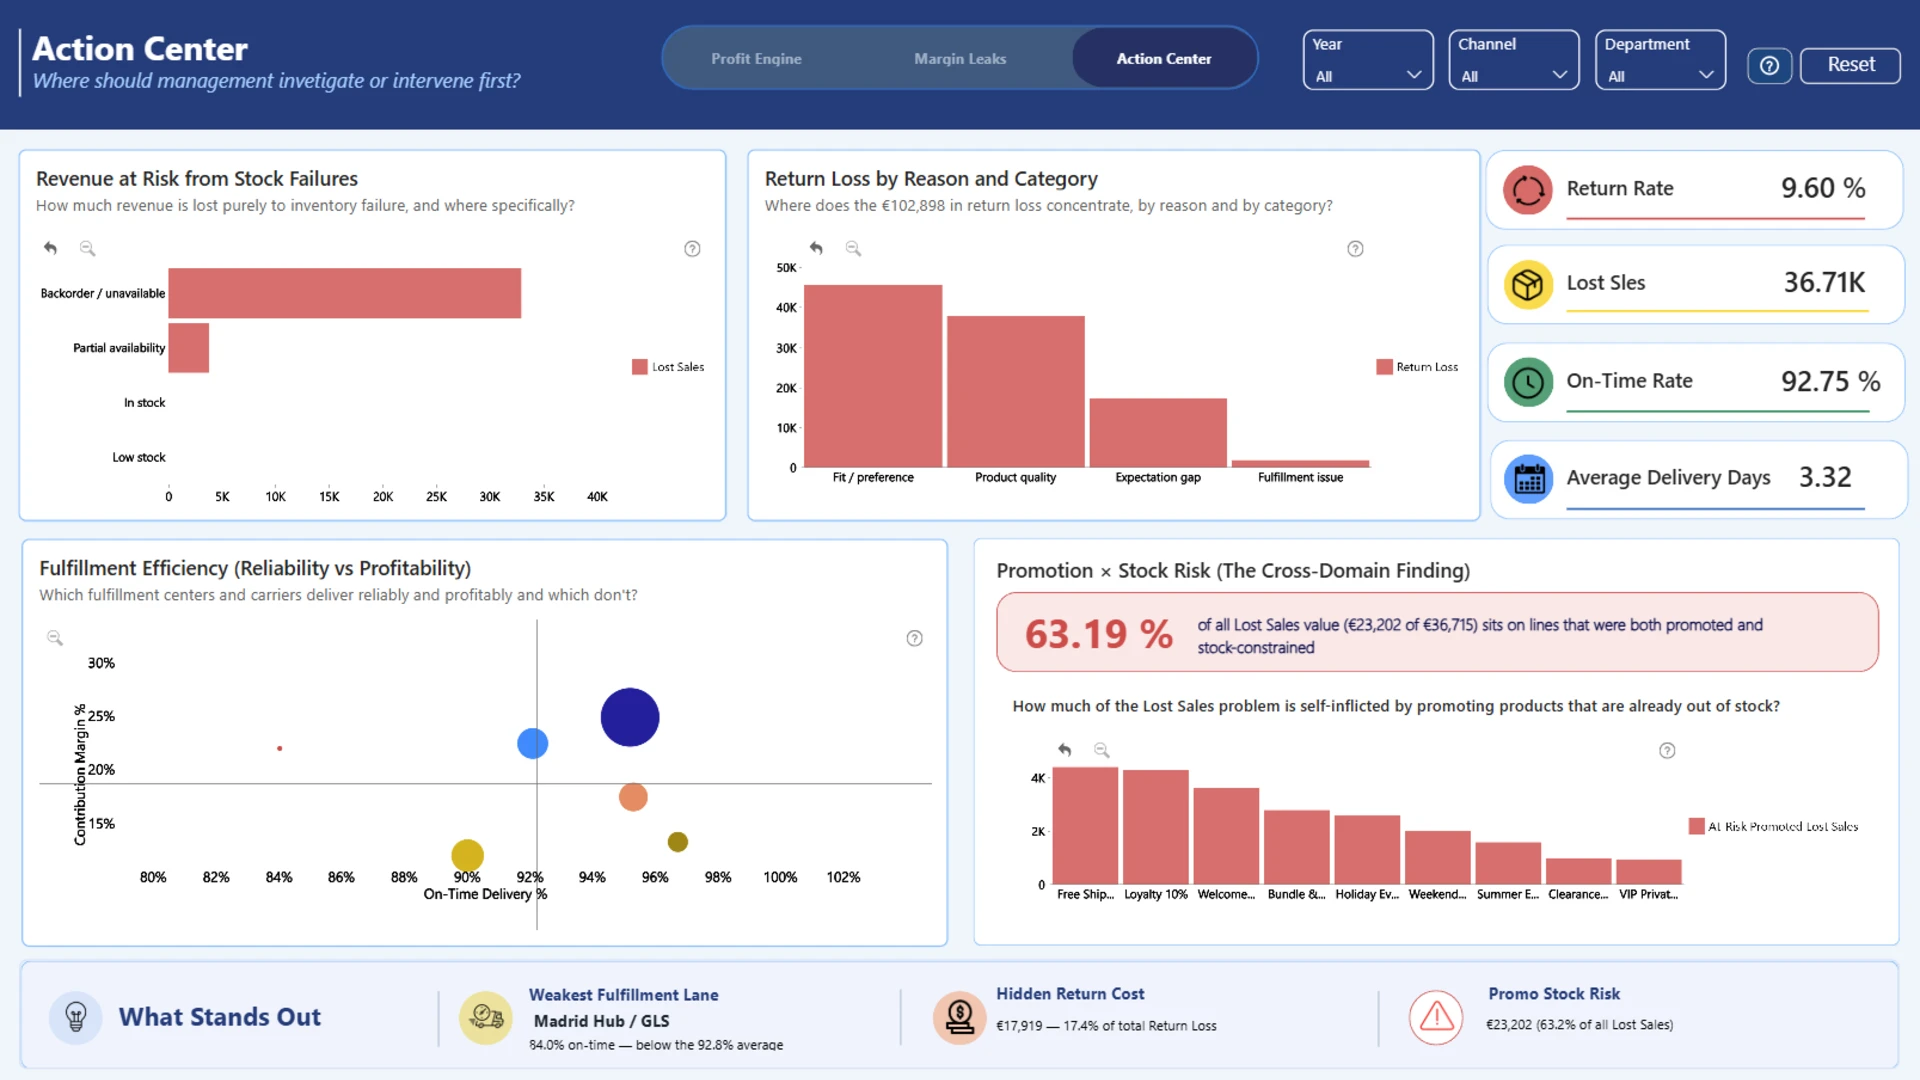
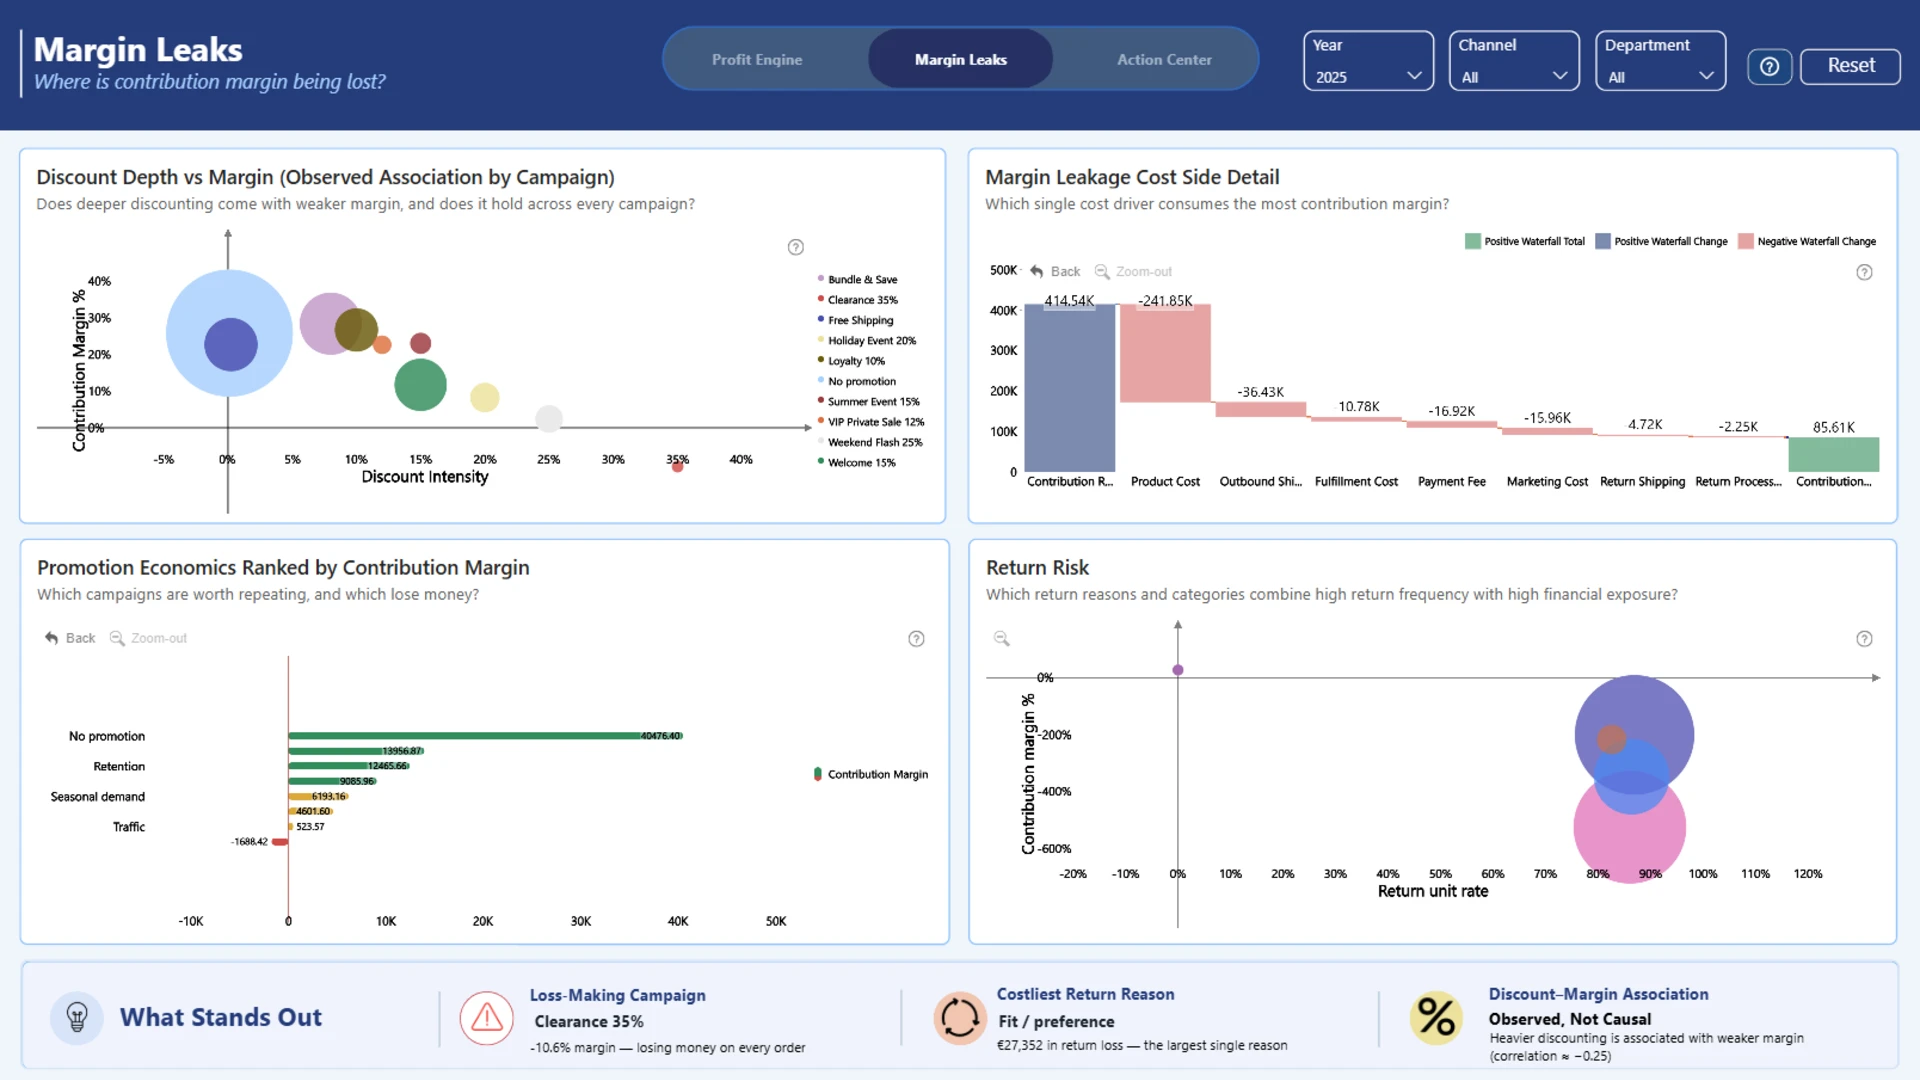
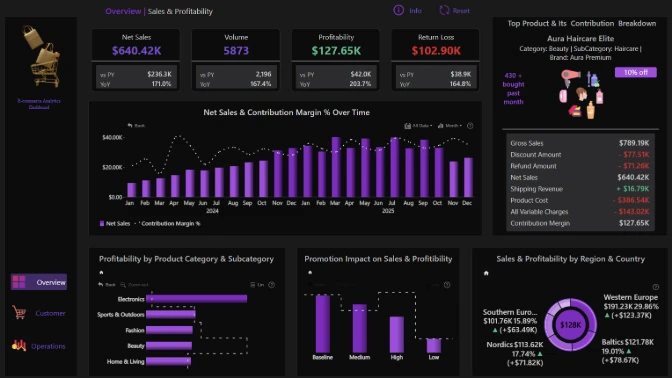
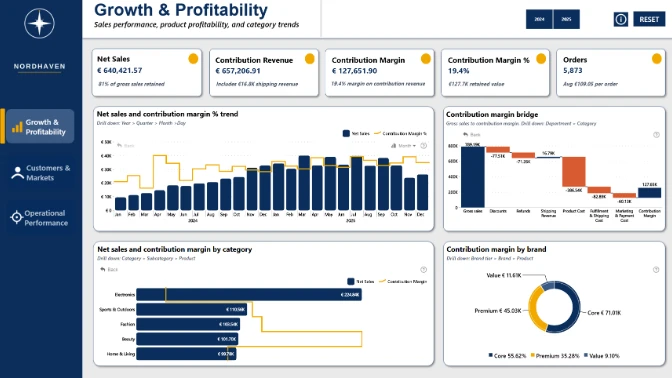
An interactive Power BI report designed to reveal what truly drives e-commerce profitability. The report moves from "Profit Engine" to "Margin Leaks" and finally to "Action Center", helping decision-makers understand where profitable growth is being created, where contribution margin is being lost, and where operational attention is needed. The analysis connects sales, contribution margin, product profitability, discounts, returns, promotions, fulfillment performance, and stock availability. ZoomCharts Drill Down visuals enable users to move from high-level KPIs into detailed time, category, subcategory, and product-level insights. Every insight is grounded in the underlying order-line data : no assumptions, no invented figures. The report is designed around four principles: clear storytelling, intuitive navigation, meaningful interactivity, and decision-ready insights.
ZoomCharts visuals used





4U Report Challenges
Participate in data challenges, build and submit reports to get free template downloads.
Join CommunityMobile view allows you to interact with the report. To Download the template please switch to desktop view.
How to use a PBIX template
Preview the interactive report, download the PBIX file, open it in Power BI Desktop, and replace the same data connection with your own dataset.
Preview and download
Explore the report online and download the PBIX template file.
Open in Power BI Desktop
Open the downloaded PBIX file in Power BI Desktop.
Connect your data
Replace the sample data source with your own dataset.
Refresh and adjust
Refresh the model and update fields or visual were needed.
Save and share
Save your report and publish it for your audience.


