116
E-commerce Profitability Analytics: From Sales Growth to Profitability Drivers
E-commerce Profitability Analytics: From Sales Growth to Profitability Drivers
More Report pages
Report Author: Meraab Hanif
116
Share template with others
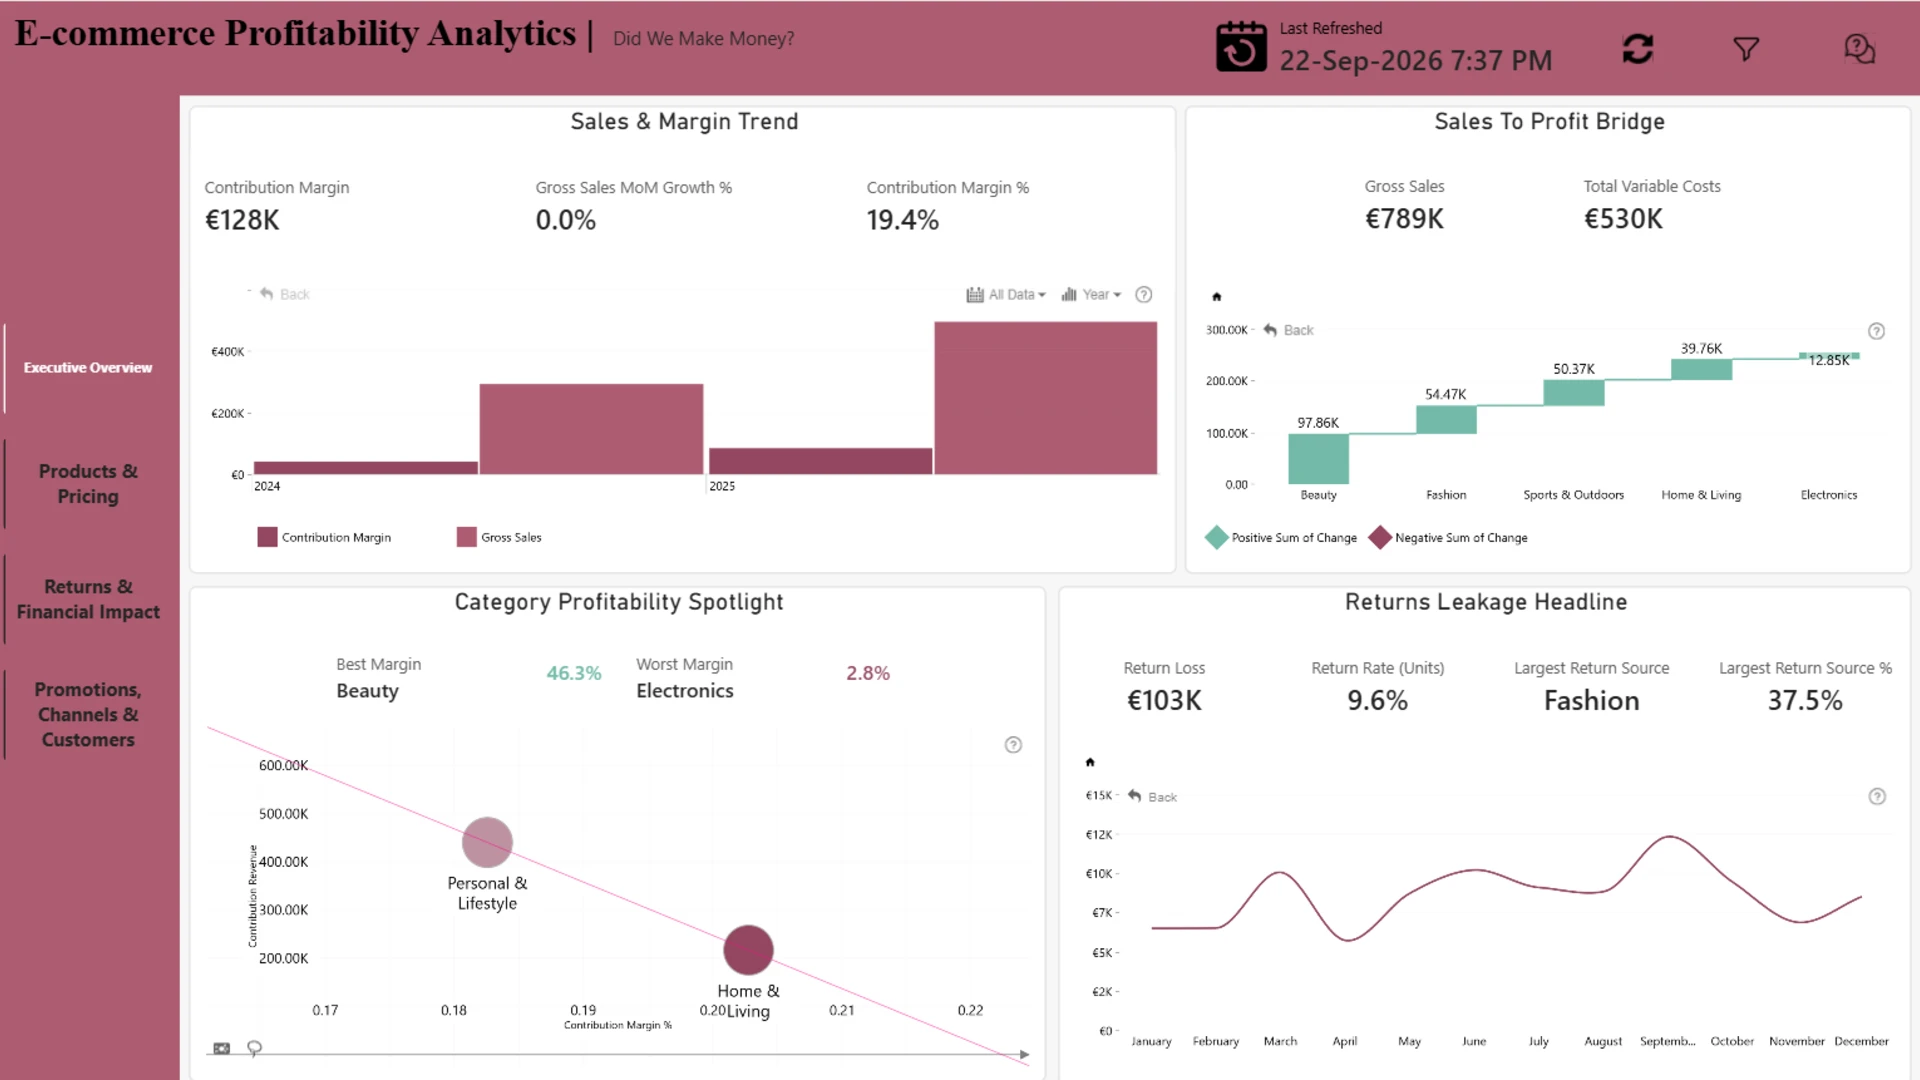
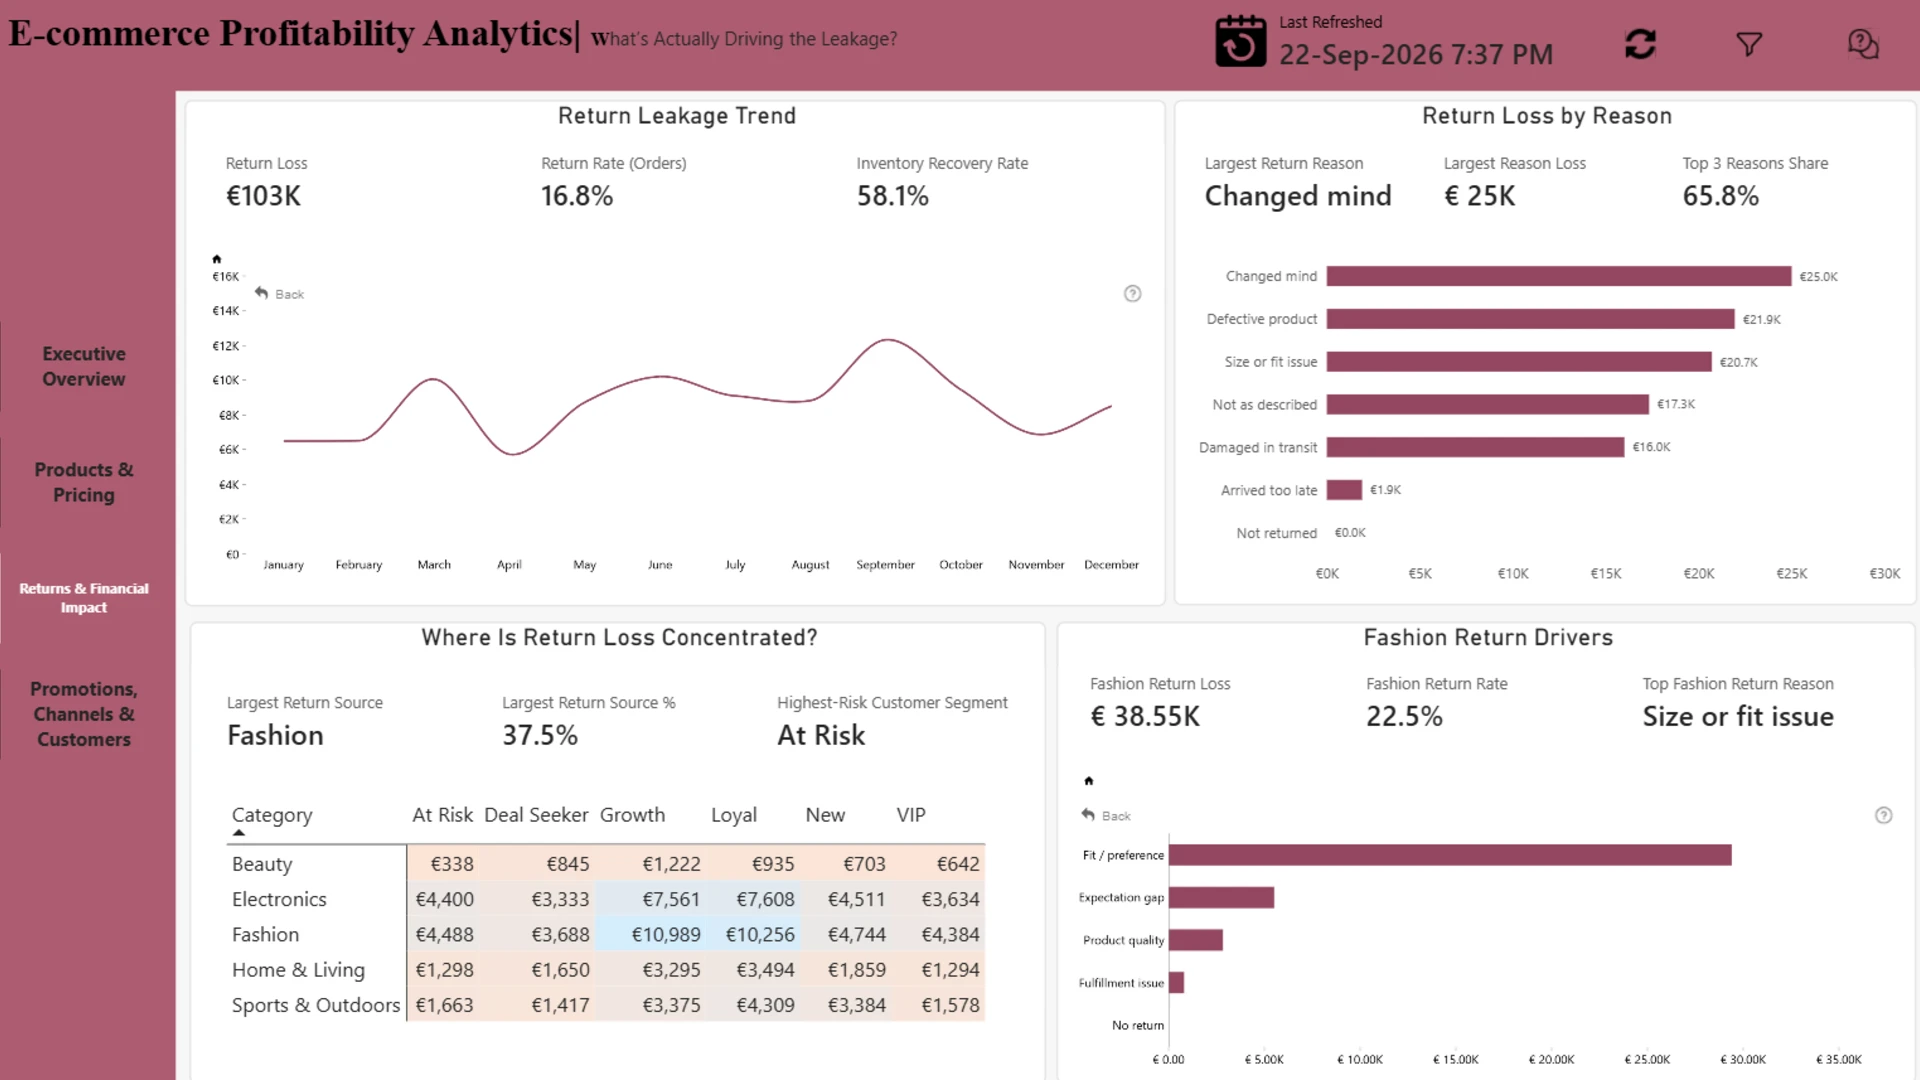
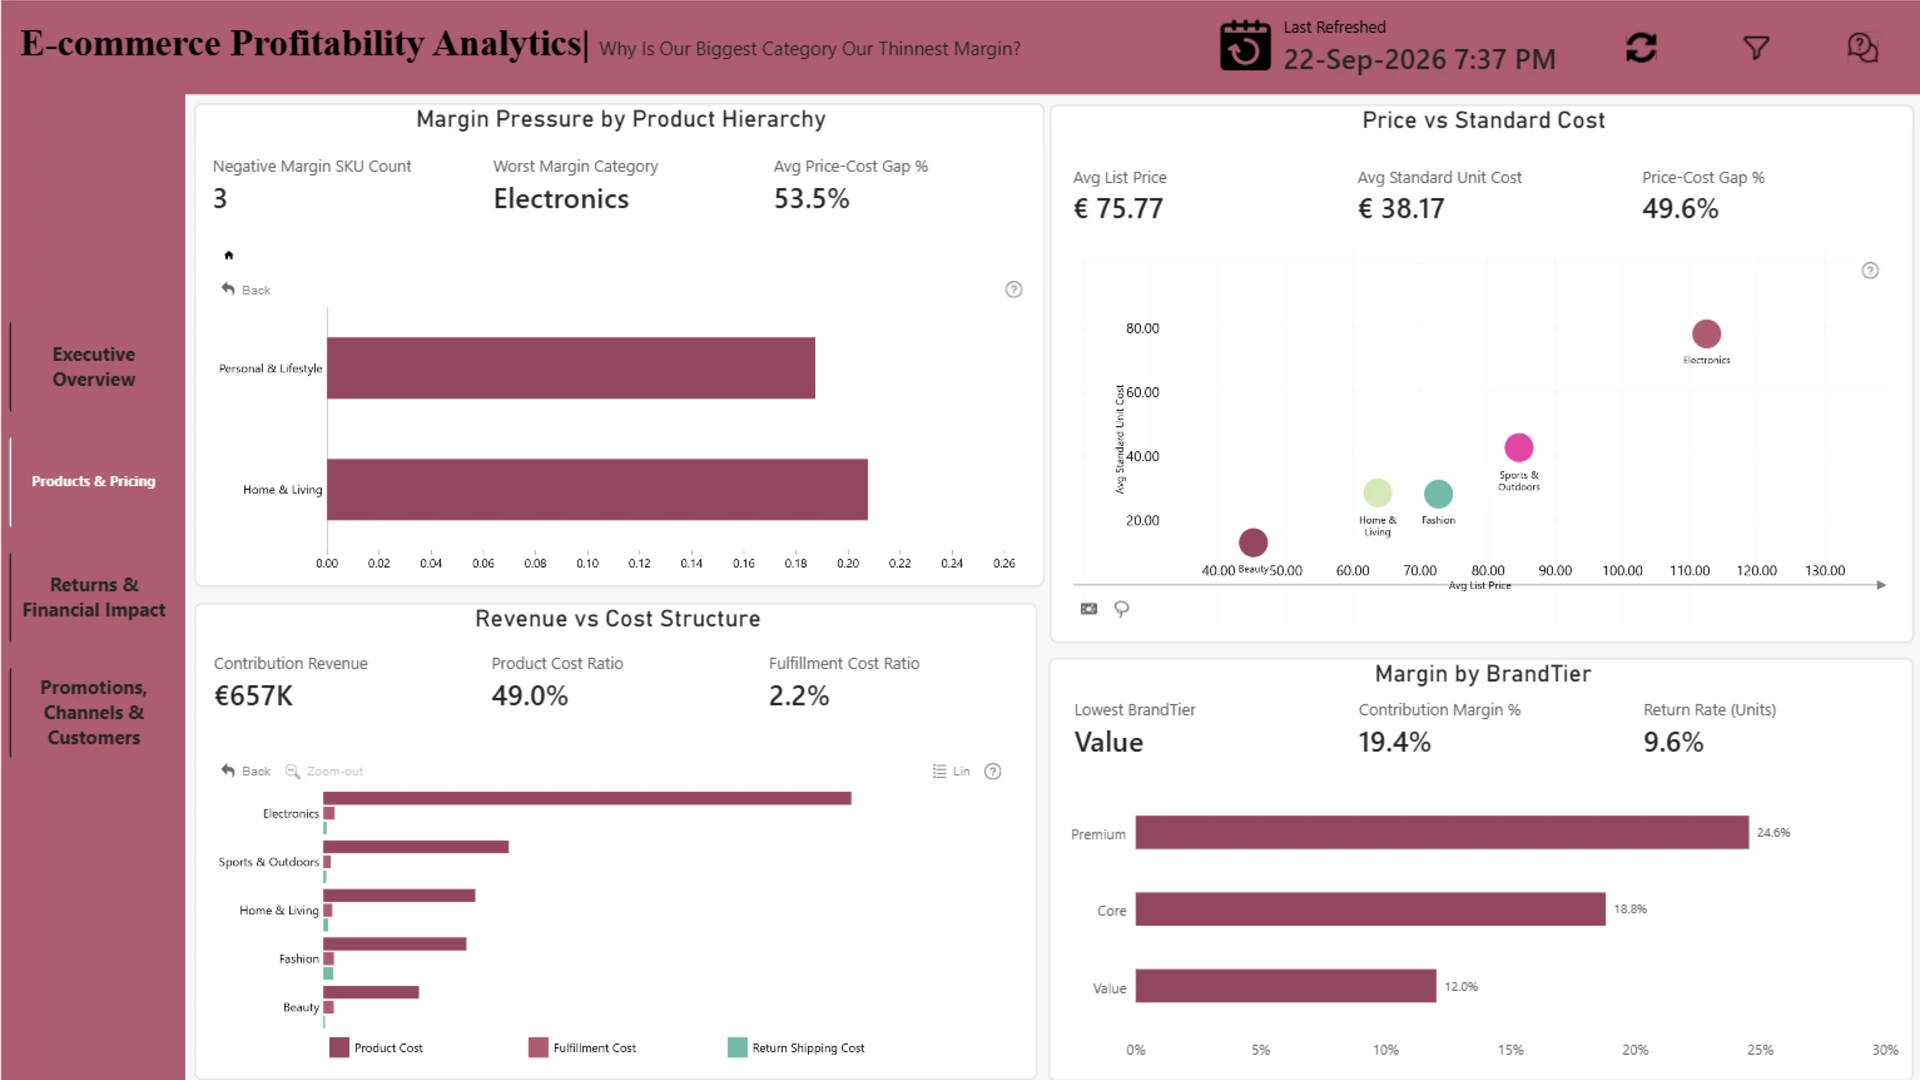
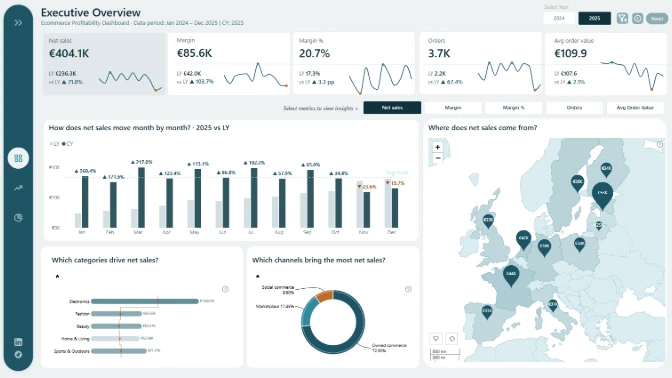
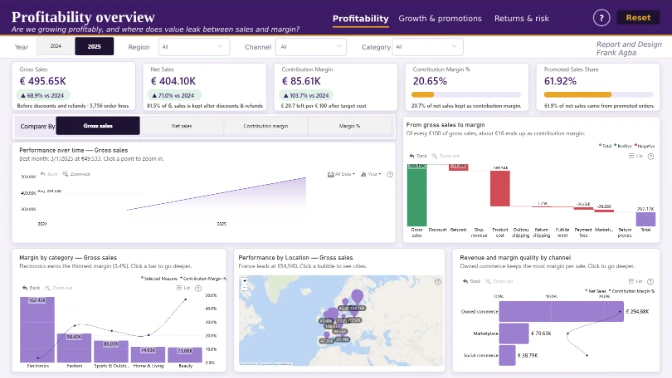
This Power BI report provides an interactive analysis of e-commerce profitability, helping decision-makers understand not only how much the business sells, but also where profit is generated and lost. The report explores overall sales and margin performance, product-level pricing and cost pressures, return-related financial leakage, and the profitability of promotions, sales channels, and customer segments. Through interactive drill-downs, comparative KPIs, and visual storytelling, users can identify margin pressure in product categories, uncover key return drivers, evaluate promotional effectiveness, and distinguish profitable growth from revenue growth that may erode contribution margins. The report is designed to support data-driven decisions around pricing, product portfolio management, returns reduction, promotional strategy, and channel optimization.
ZoomCharts visuals used






4U Report Challenges
Participate in data challenges, build and submit reports to get free template downloads.
Join CommunityMobile view allows you to interact with the report. To Download the template please switch to desktop view.
How to use a PBIX template
Preview the interactive report, download the PBIX file, open it in Power BI Desktop, and replace the same data connection with your own dataset.
Preview and download
Explore the report online and download the PBIX template file.
Open in Power BI Desktop
Open the downloaded PBIX file in Power BI Desktop.
Connect your data
Replace the sample data source with your own dataset.
Refresh and adjust
Refresh the model and update fields or visual were needed.
Save and share
Save your report and publish it for your audience.


