204
E-commerce Analytics Dashboard 3
E-commerce Analytics Dashboard 3
More Report pages
Report Author: Nkanyiso Gwane
204
Share template with others
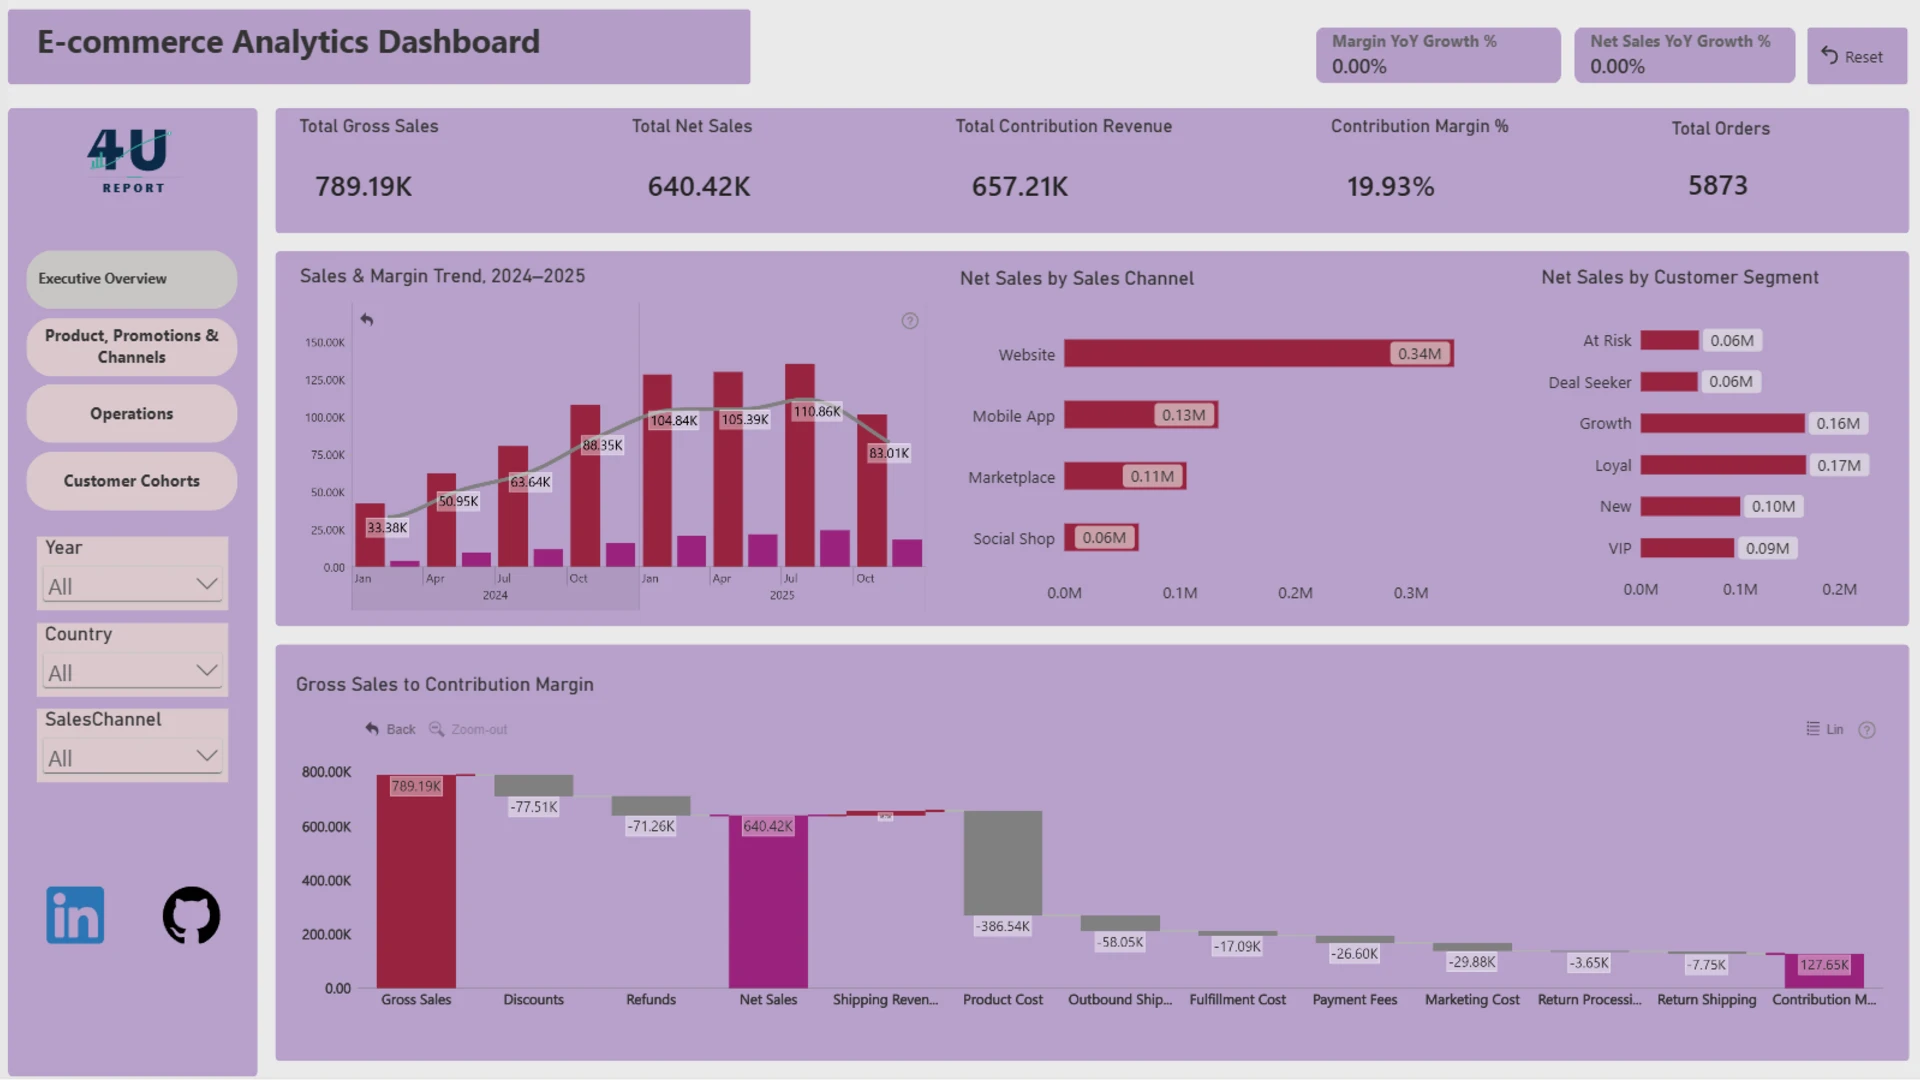
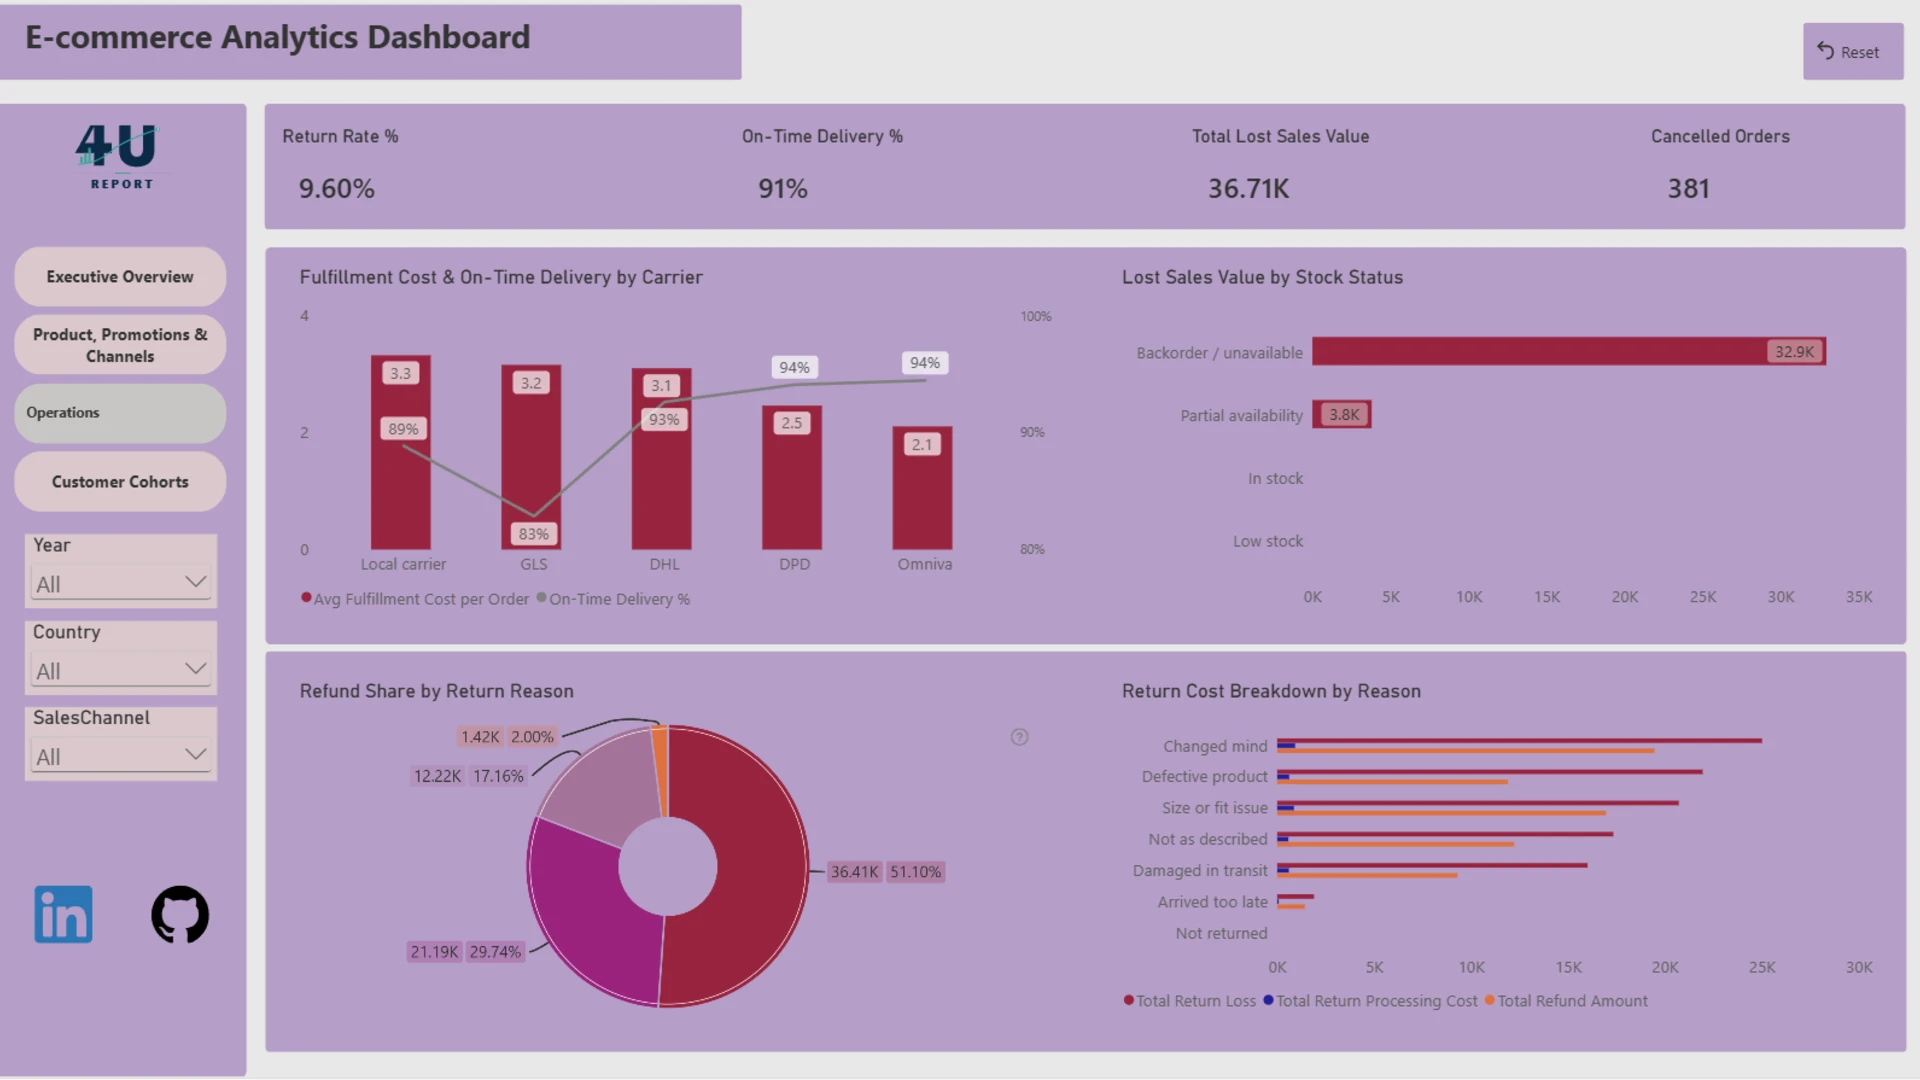
An interactive Power BI dashboard analyzing a European e-commerce dataset (9,000+ order lines, 2024–2025) across the full path from gross sales to contribution margin. The report is organized into four pages: an Executive Overview tracking sales and margin trends with a Gross-to-Contribution-Margin waterfall; Product, Promotions & Channels, comparing category performance, campaign discount depth vs. margin, and sales across European markets; Operations, covering fulfillment cost/speed by carrier, return reasons, and lost sales from stock unavailability; and a Customer Cohorts drill-through page exploring segment, loyalty tier, acquisition channel, and lifecycle-based repeat purchase behavior. Built with ZoomCharts Drill Down TimeSeries PRO, Waterfall PRO, Combo PRO, Map PRO, and Donut PRO for interactive, multi-level exploration alongside native Power BI visuals.
ZoomCharts visuals used





4U Report Challenges
Participate in data challenges, build and submit reports to get free template downloads.
Join CommunityMobile view allows you to interact with the report. To Download the template please switch to desktop view.



How to use a PBIX template
Preview the interactive report, download the PBIX file, open it in Power BI Desktop, and replace the same data connection with your own dataset.
Preview and download
Explore the report online and download the PBIX template file.
Open in Power BI Desktop
Open the downloaded PBIX file in Power BI Desktop.
Connect your data
Replace the sample data source with your own dataset.
Refresh and adjust
Refresh the model and update fields or visual were needed.
Save and share
Save your report and publish it for your audience.


