928
E-Commerce Analysis 3
E-Commerce Analysis 3
Report Author: Nina Ikpe
928
Share template with others
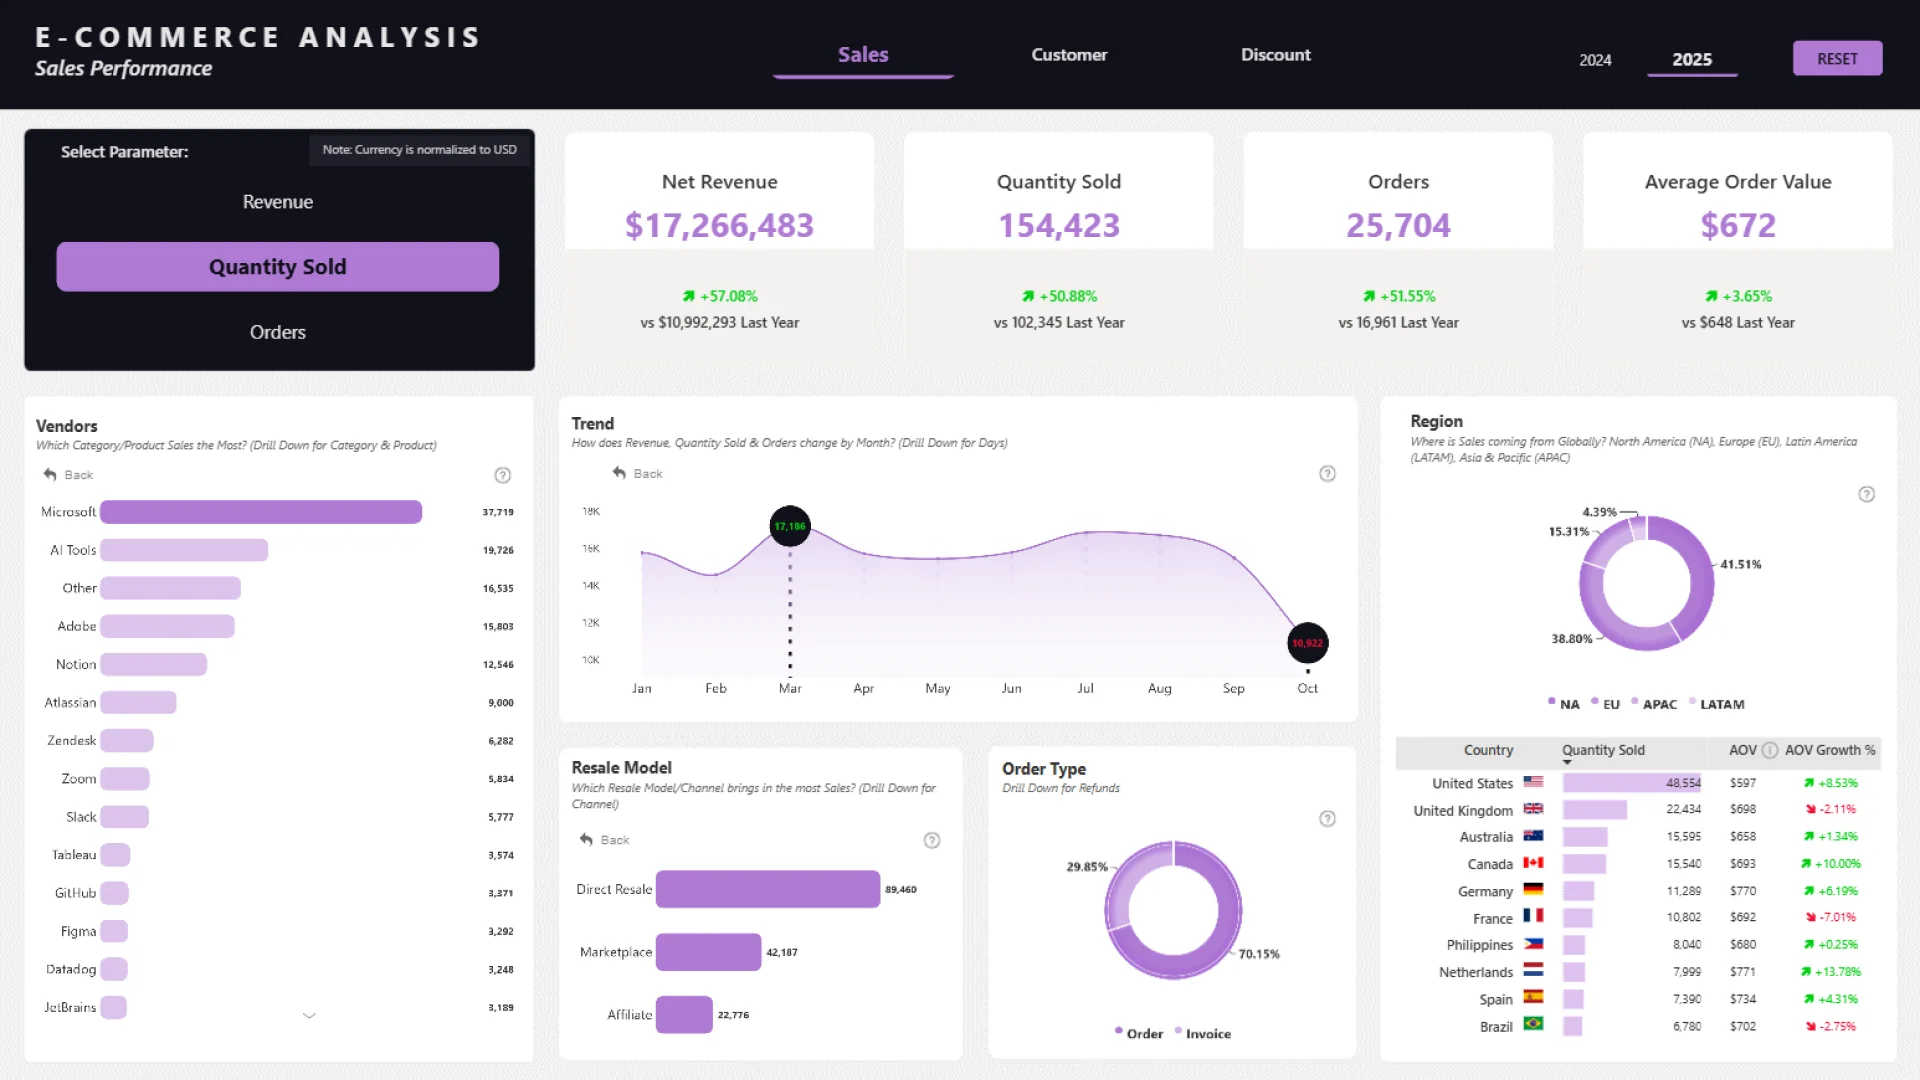
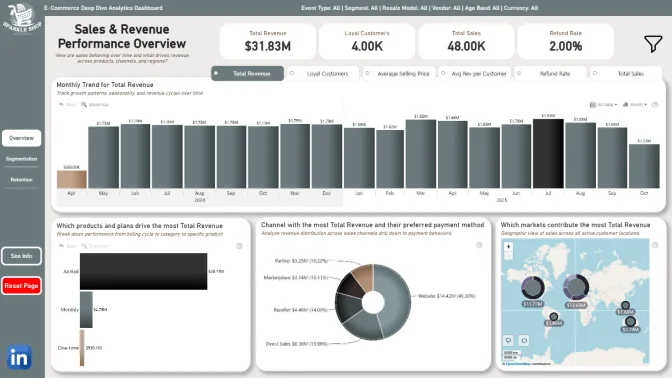
This Power BI report uses the e-commerce sales dataset from a global software retailer that sells subscriptions and add-ons across analytics, design, collaboration, and AI. The report features ZoomCharts Drill Down PRO custom visuals for Power BI. It was submitted to the Onyx Data DataDNA ZoomCharts Mini Challenge in October 2025.
Author description:
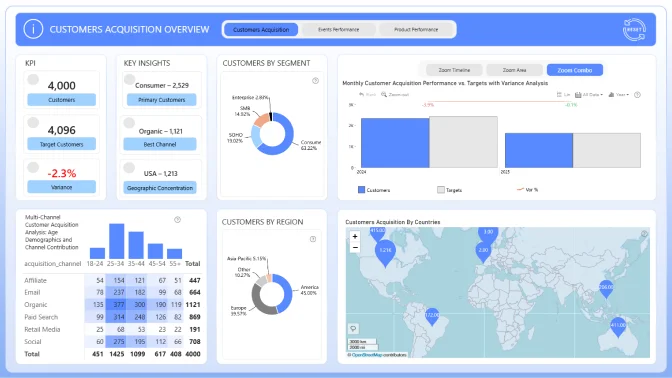
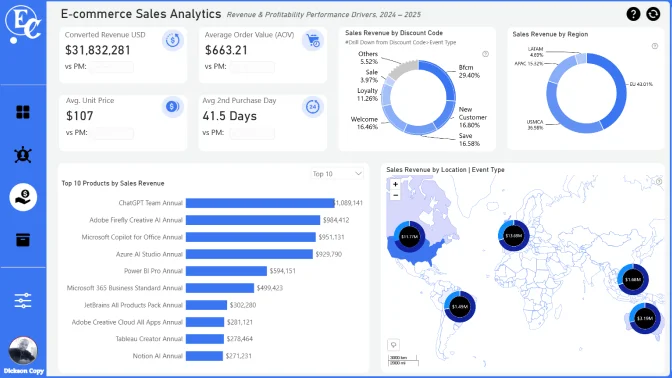
This report gives a simple, clear look at how a global software retailer e-commerce business is doing. It provides a comprehensive view of the e-commerce performance across sales, customer behavior, and discount impact. The first page walks through the sales story - what is selling, where the revenue is coming from, and which Regions/countries and channels are leading the way. The second page zooms in on the customers, showing who they are, where they are located globally, how often they come back, and how long it takes them to make their next purchase. The last page looks at the impact of discounts, highlighting which products get discounted most and whether those discounts actually help or hurt revenue. Altogether, the report makes it easy to understand what is working, what needs attention, and where the biggest opportunities are.
ZoomCharts visuals used




4U Report Challenges
Participate in data challenges, build and submit reports to get free template downloads.
Join CommunityMobile view allows you to interact with the report. To Download the template please switch to desktop view.
How to use a PBIX template
Preview the interactive report, download the PBIX file, open it in Power BI Desktop, and replace the same data connection with your own dataset.
Preview and download
Explore the report online and download the PBIX template file.
Open in Power BI Desktop
Open the downloaded PBIX file in Power BI Desktop.
Connect your data
Replace the sample data source with your own dataset.
Refresh and adjust
Refresh the model and update fields or visual were needed.
Save and share
Save your report and publish it for your audience.


