1626
DataDNA challenge Udemy product subscription and revenue analysis_Xiuting LIANG
DataDNA challenge Udemy product subscription and revenue analysis_Xiuting LIANG
Report Author: Ripple Liang
1626
Share template with others
Report submitted for Onyx Data DataDNA ZoomCharts Mini Challenge, January 2024. The report was built based on Udemy Courses dataset and includes ZoomCharts custom Drill Down PRO visuals for Power BI.
Author's description:
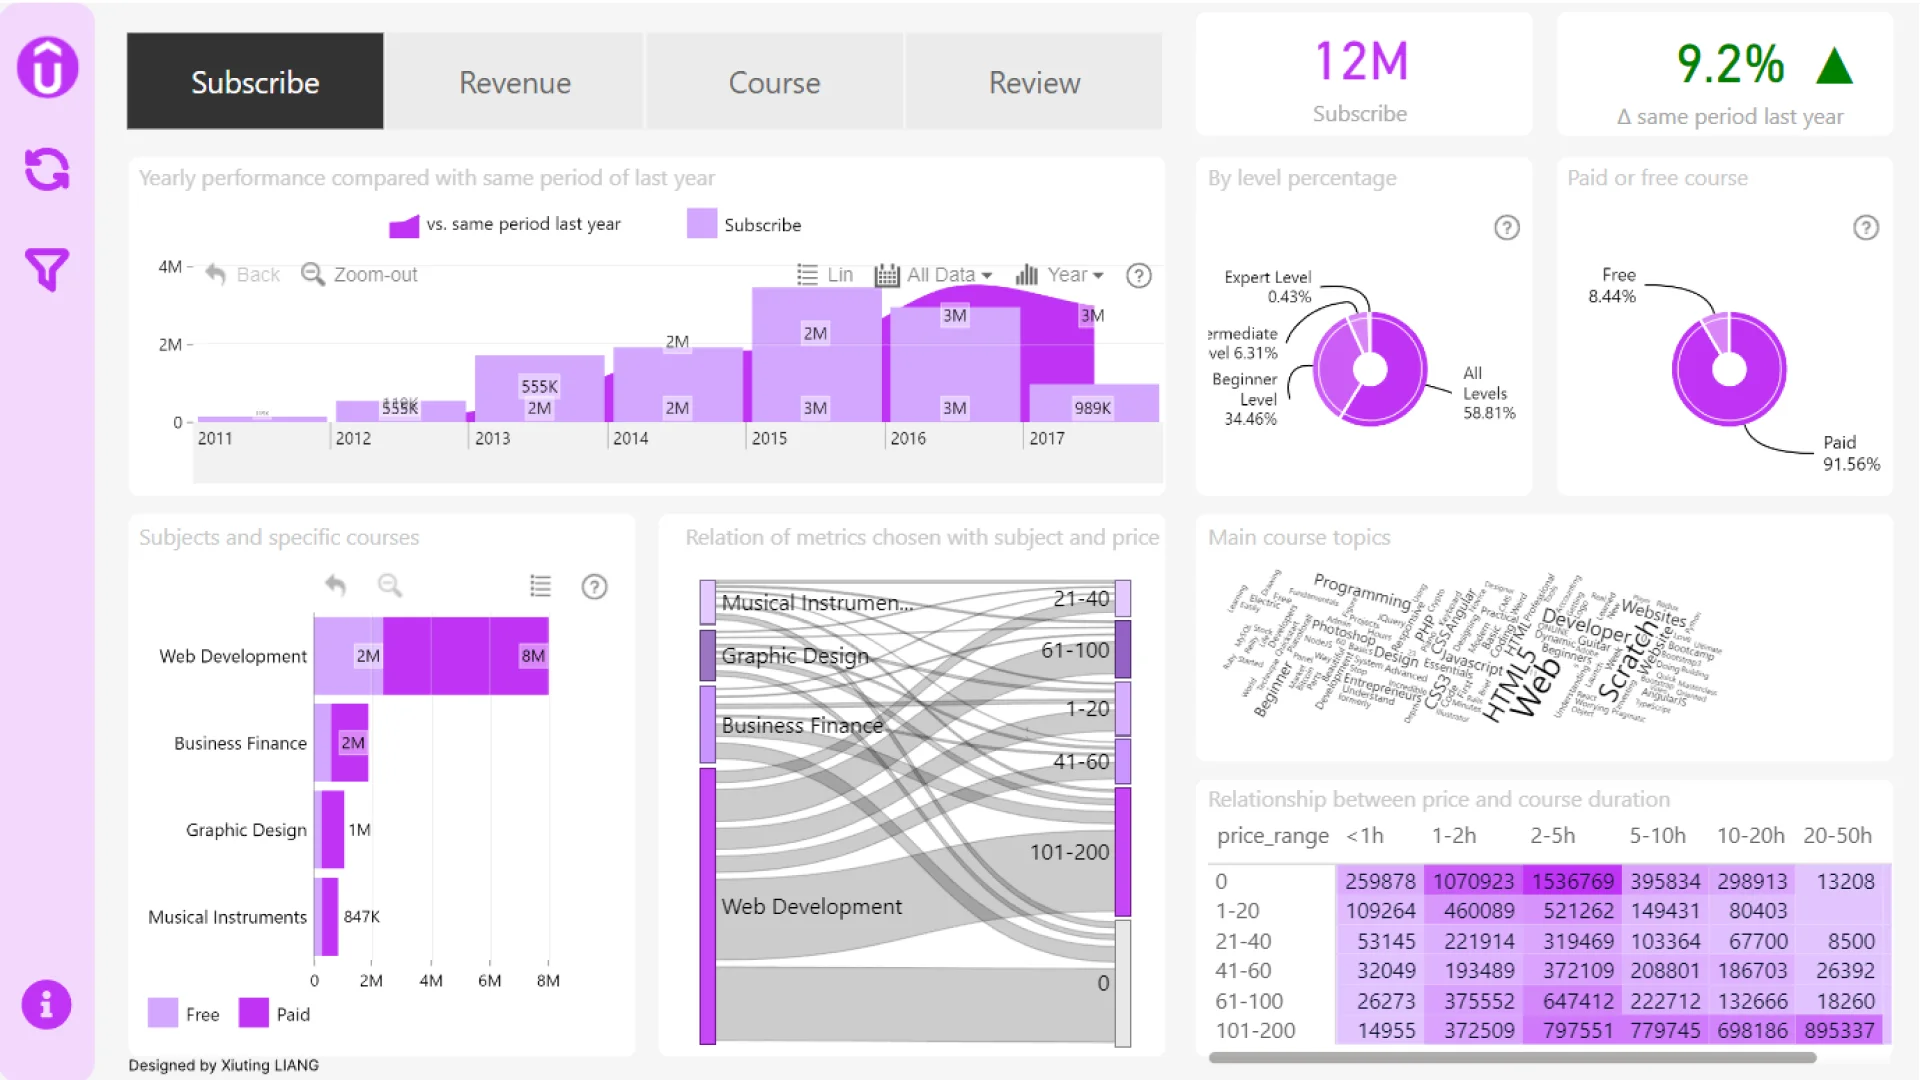
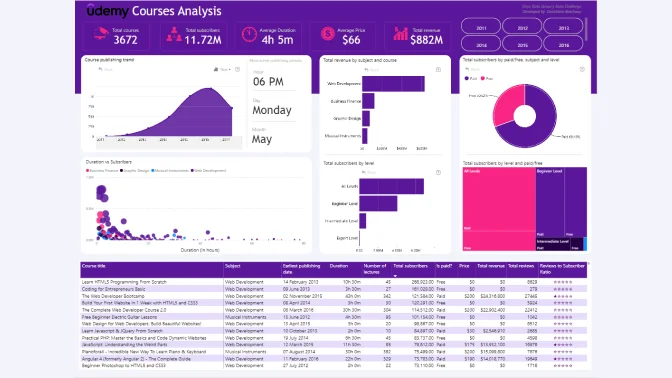
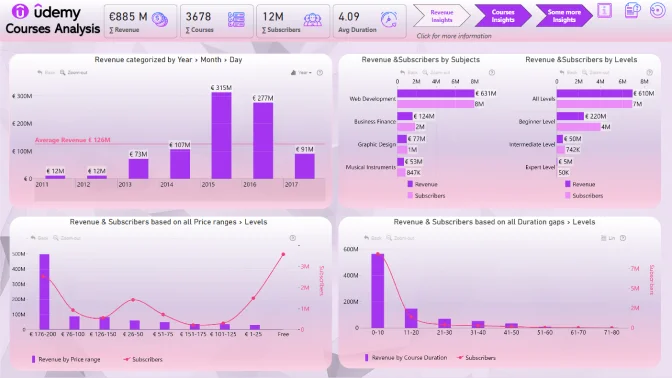
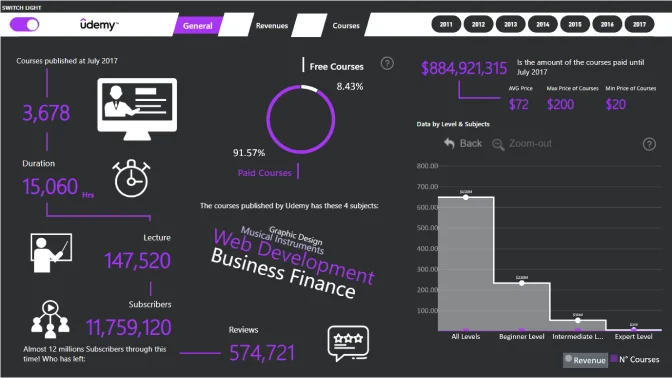
In the analysis, you can have general views of Udemy courses and how they generate revenue and subscriptions. It is an effective analysis for products, sales, and subscriptions. It answers questions:
- How do revenue and subscriptions change yearly?
- Current period vs. the same period of last year?
- Which are the most welcome or less welcome courses? And what is the relationship between price, course duration, review, and subjects?
- For each category, what are the courses about, shown with main keywords?
- How is the performance of free/paid course? etc.
It is user-friendly with a clear user guide and apps like interface.
4U Report Challenges
Participate in data challenges, build and submit reports to get free template downloads.
Join CommunityMobile view allows you to interact with the report. To Download the template please switch to desktop view.
Was this helpful? Thank you for your feedback!
Sorry about that.
How can we improve it?