849
DataDNA Challenge Nov'23 Top Youtuber Creator
DataDNA Challenge Nov'23 Top Youtuber Creator
Report Author: Ajay Singh
849
Share template with others
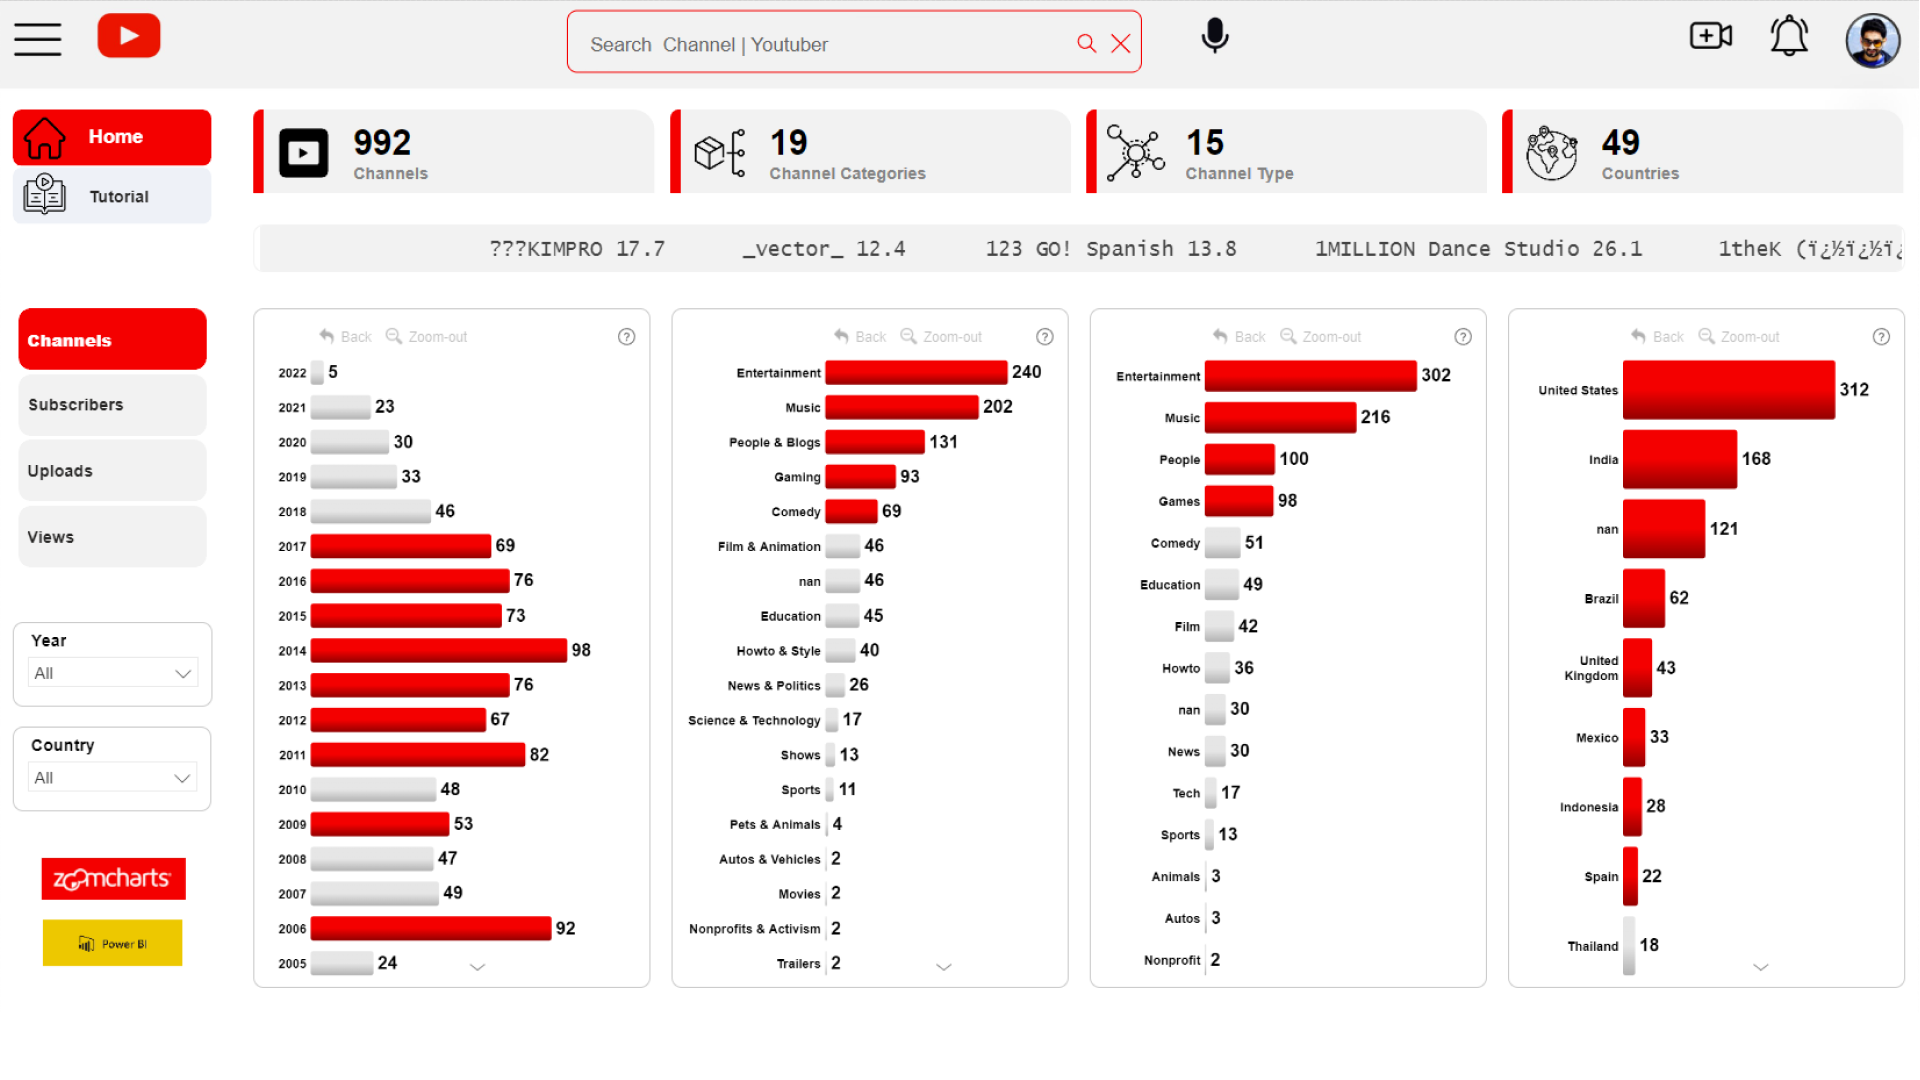
Report submitted for Onyx Data DataDNA ZoomCharts Mini Challenge, November 2023. The report was built based on Top YouTubers dataset and includes ZoomCharts custom Drill Down PRO visuals for Power BI.
Author's description:
A sneak peek into the world of YouTube's Top Channels and Creators harnessing the power of Power BI. In the ever-evolving digital landscape, understanding trends and influencers is paramount. This Power BI report delves deep into the realms of YouTube to unveil key insights into the top channels and creators shaping the online content space.
🔍 Key Highlights:
📌Channel Performance Metrics: Uncover engagement rates, subscriptions, and view trends for the crème de la crème of YouTube channels.
📌Top Creators: Uncover the creative geniuses behind the most-watched content and explore their content genres and trends.
📌Geographical Impact: Discover the global impact of these channels. This report breaks down viewership across different regions, helping creators tailor their content strategies for diverse audiences.
📌Monetization: Explore how much top creators makes from their content.


4U Report Challenges
Participate in data challenges, build and submit reports to get free template downloads.
Join CommunityMobile view allows you to interact with the report. To Download the template please switch to desktop view.
How to use a PBIX template
Preview the interactive report, download the PBIX file, open it in Power BI Desktop, and replace the same data connection with your own dataset.
Preview and download
Explore the report online and download the PBIX template file.
Open in Power BI Desktop
Open the downloaded PBIX file in Power BI Desktop.
Connect your data
Replace the sample data source with your own dataset.
Refresh and adjust
Refresh the model and update fields or visual were needed.
Save and share
Save your report and publish it for your audience.


