3018
Data Quality Power BI Report
Data Quality Power BI Report
More Report pages
Report Author: Akindele Omolayo
3018
Share template with others
This Power BI report is built using the Enterprise Data Governance Dataset and features ZoomCharts Drill Down PRO custom visuals for Power BI. It was submitted to the FP20 Analytics ZoomCharts Data Challenge #34 (January 2026 – February 2026).
Author's Description:
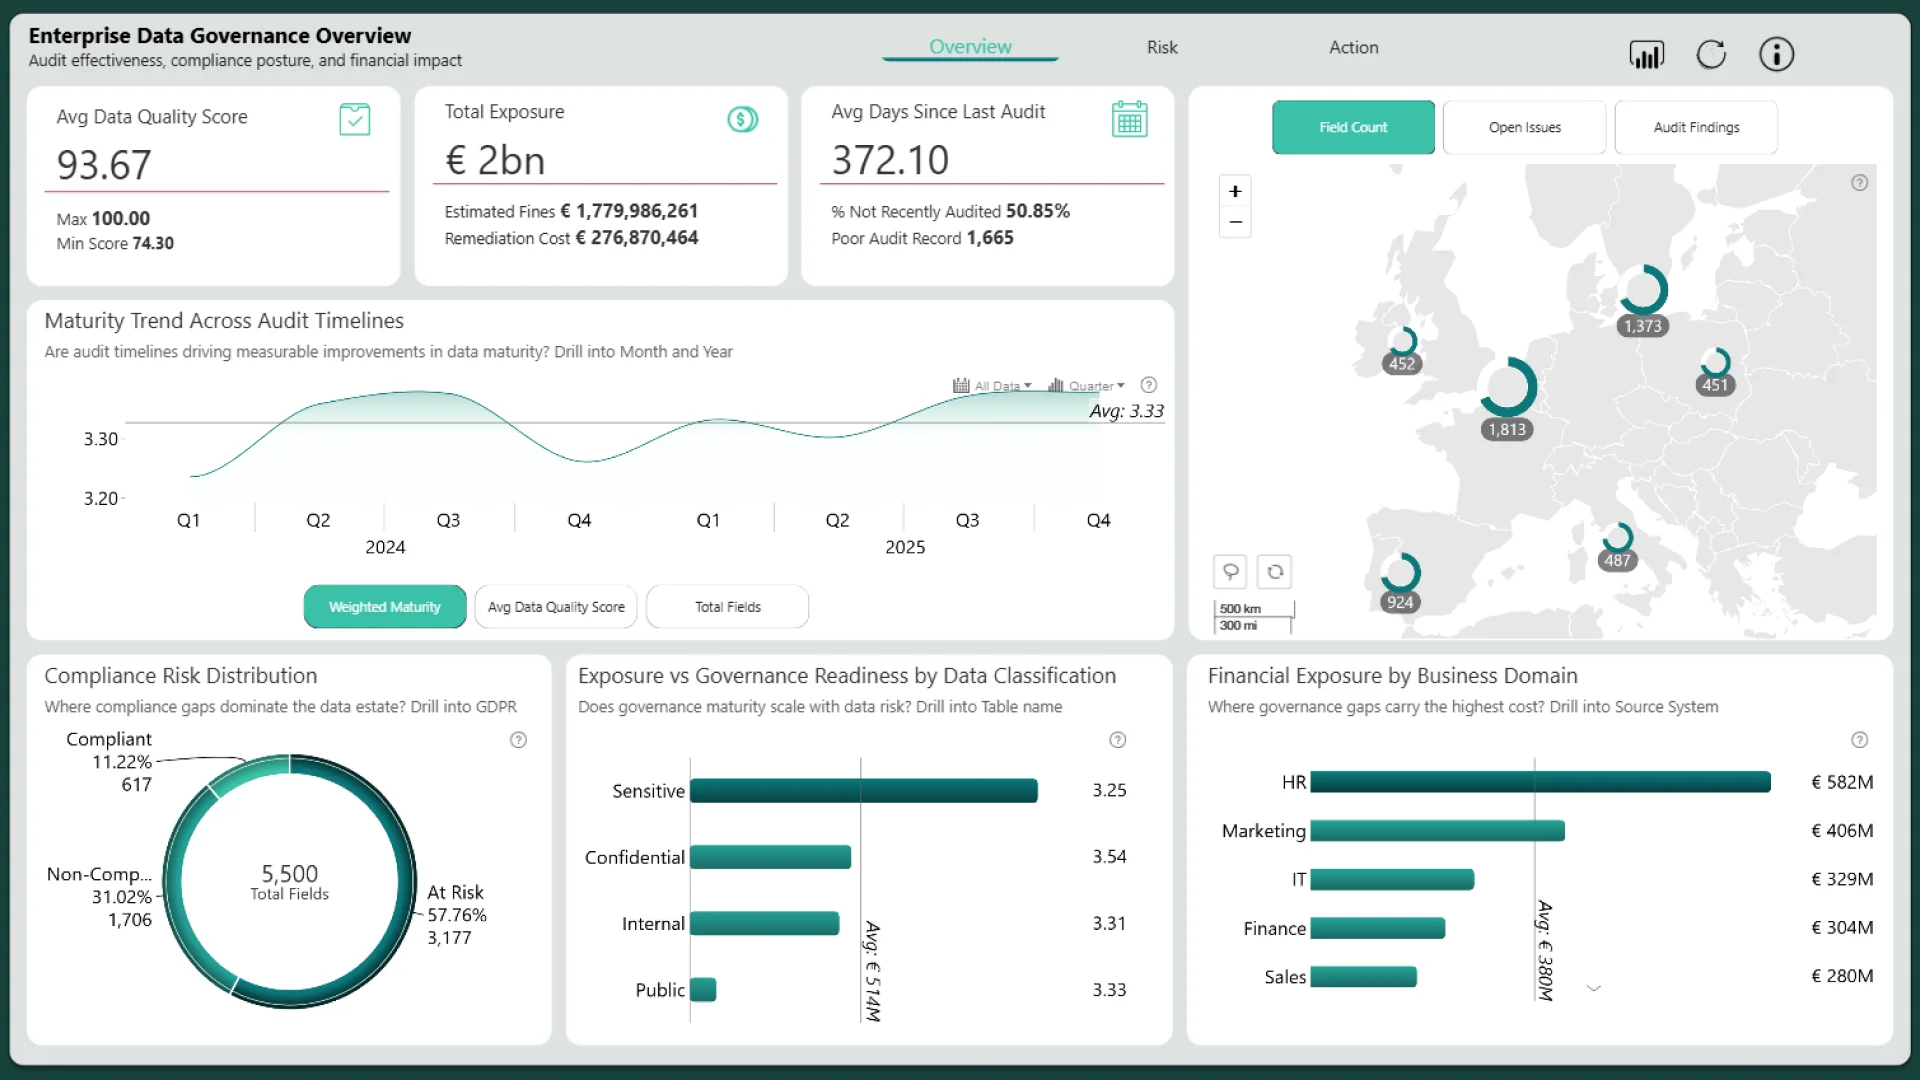
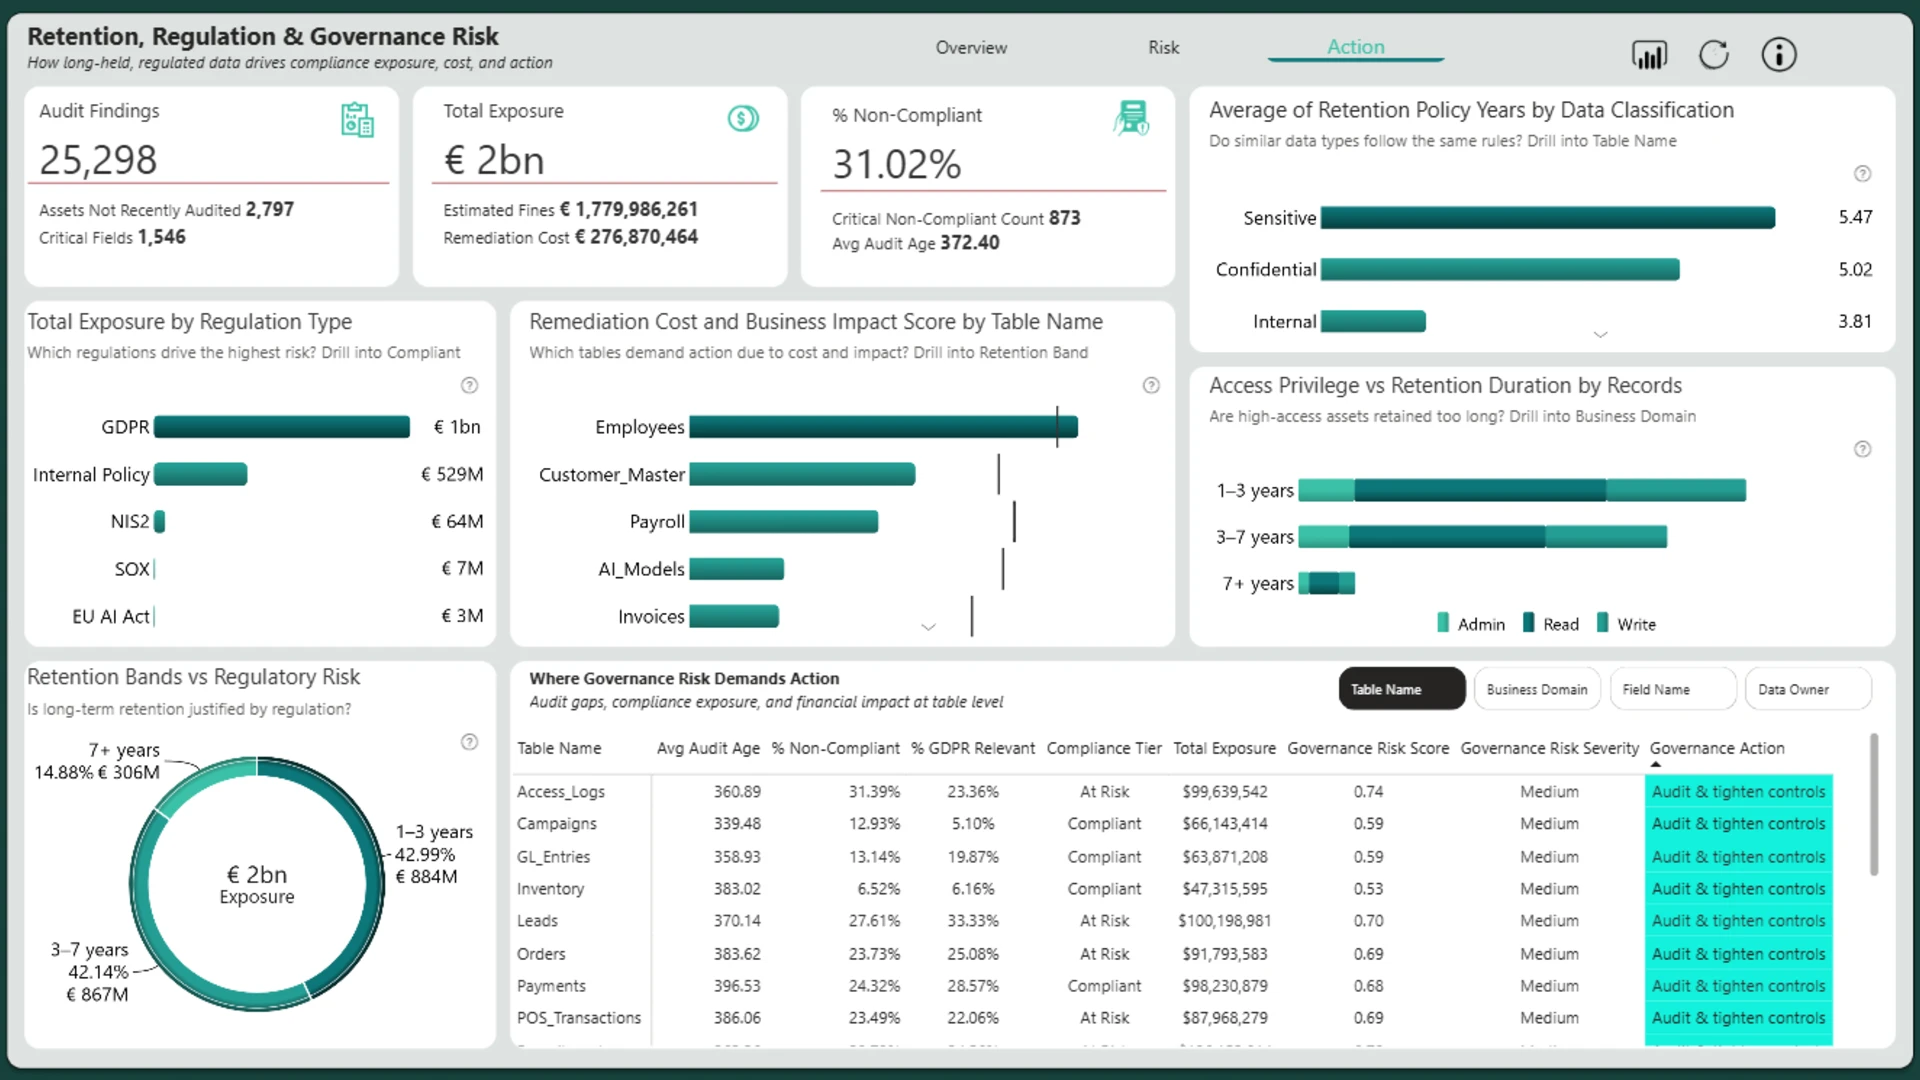
Page 1 – Overview establishes the enterprise governance baseline by linking data quality, financial exposure, and audit freshness, showing how maturity has evolved and where compliance risk is concentrated by domain and data classification. Page 2 – Risk explains the drivers of governance risk by analysing audit recency, access levels, and unresolved issues, highlighting domains with outdated audits, poor accuracy, and high issue density that amplify compliance and operational risk. Page 3 – Action translates risk into action by connecting retention behaviour, regulatory exposure, and financial impact, identifying over-retained and highly regulated data as well as the tables driving the highest remediation costs. Together, the pages guide leaders toward targeted governance interventions that deliver the greatest risk reduction.
ZoomCharts visuals used
4U Report Challenges
Participate in data challenges, build and submit reports to get free template downloads.
Join CommunityMobile view allows you to interact with the report. To Download the template please switch to desktop view.
Was this helpful? Thank you for your feedback!
Sorry about that.
How can we improve it?