2180
Data-driven Insights for Educational Planning
Data-driven Insights for Educational Planning
More Report pages
Report Author: Prathamesh Sawant
2180
Share template with others
Report submitted for FP20 Analytics ZoomCharts Challenge 13 (Jan 17 – Feb 15, 2024). The report was built with Education Management dataset and includes ZoomCharts custom Drill Down PRO visuals for Power BI.
Author's description:
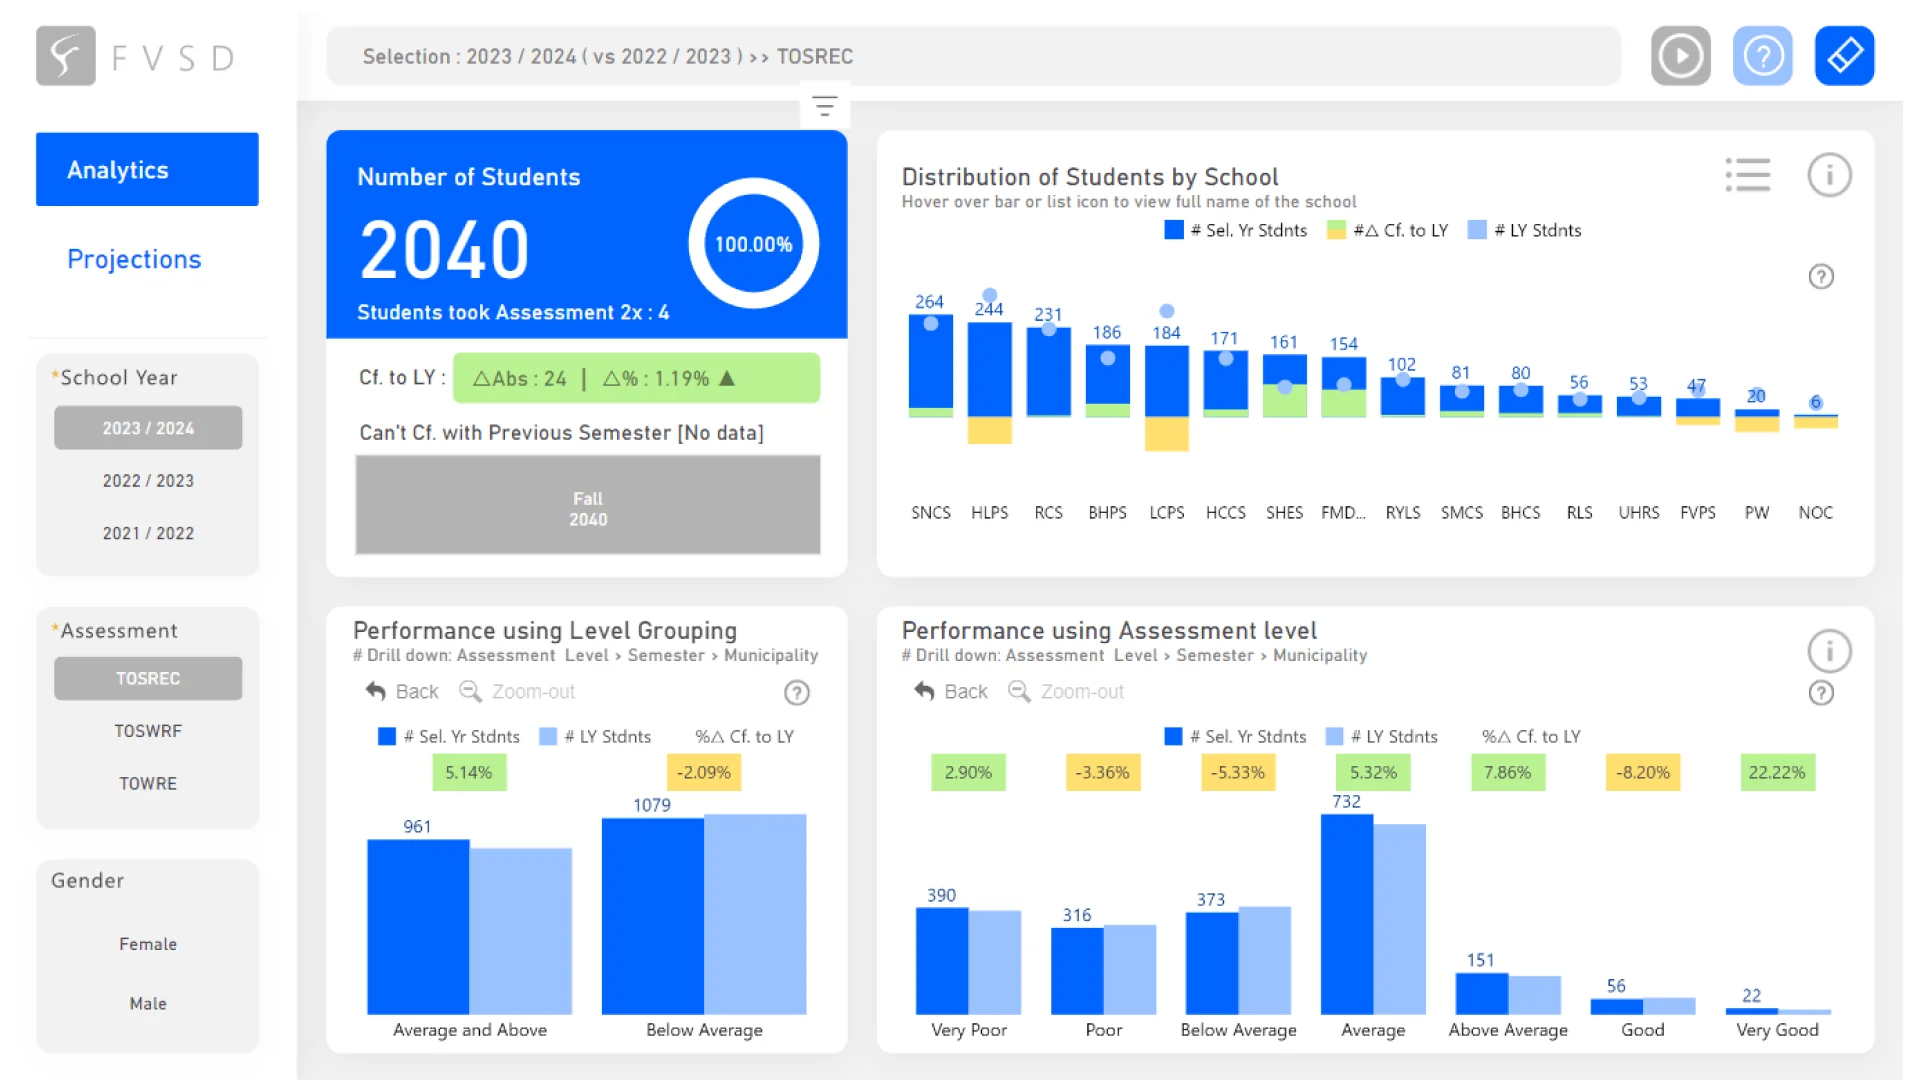
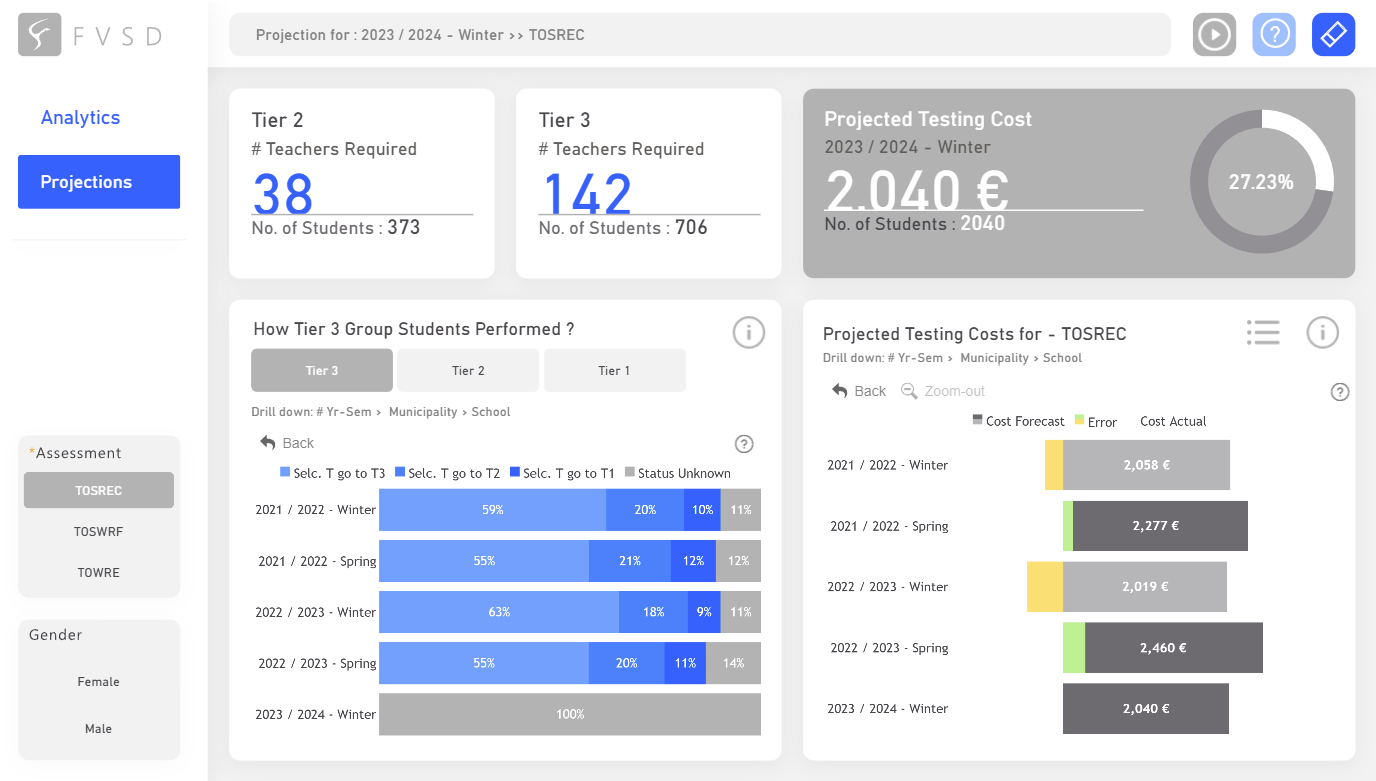
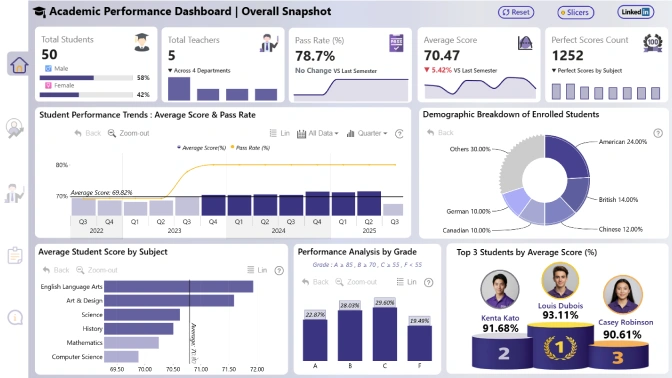
This submission presents a Power BI dashboard tailored to meet the analytical needs of educational stakeholders. Leveraging ZoomCharts Drill Down visuals and adhering to the technical requirements, the report provides an intuitive interface for exploring educational data from the Fort Vermilion School Division (FVSD).
Key Features:
Analytics Page: The hero card offers essential metrics including total student count, student percentage, repeat assessment takers, distribution by semester, and comparisons with previous semesters. ZoomCharts Drill Down Combo column chart showcases student distribution by school, assessment level, and semester, enabling in-depth exploration. Interactive visuals depict changes in student assessment participation over time, fostering a deeper understanding of educational dynamics.
Projections Page: Concise cards provide insights into intervention groups, required teacher resources, and projected testing costs. ZoomCharts Drill Down Combo Bar charts illustrate student performance shifts across intervention tiers and projected testing costs by school year. User-friendly layout with a simple color palette, GIF tutorials, and informative overlays ensure seamless navigation and understanding.


4U Report Challenges
Participate in data challenges, build and submit reports to get free template downloads.
Join CommunityMobile view allows you to interact with the report. To Download the template please switch to desktop view.
How to use a PBIX template
Preview the interactive report, download the PBIX file, open it in Power BI Desktop, and replace the same data connection with your own dataset.
Preview and download
Explore the report online and download the PBIX template file.
Open in Power BI Desktop
Open the downloaded PBIX file in Power BI Desktop.
Connect your data
Replace the sample data source with your own dataset.
Refresh and adjust
Refresh the model and update fields or visual were needed.
Save and share
Save your report and publish it for your audience.


