884
Data DNA Challenge
Data DNA Challenge
More Report pages
Report Author: Vishnukanth K
884
Share template with others
Report submitted for Onyx Data DataDNA ZoomCharts Mini Challenge, May 2024. The report was built based on Tech Support Analysis dataset and includes ZoomCharts custom Drill Down PRO visuals for Power BI.
Author's description:
This dynamic dashboard is designed to provide comprehensive insights into our DNAChallenge metrics across various dimensions. Here's a quick overview of what you'll find in the dashboard:
🏠 Home Page: Dive into key trends such as ticket volume fluctuations, comparison between workdays and weekends, and analysis of resolution time.
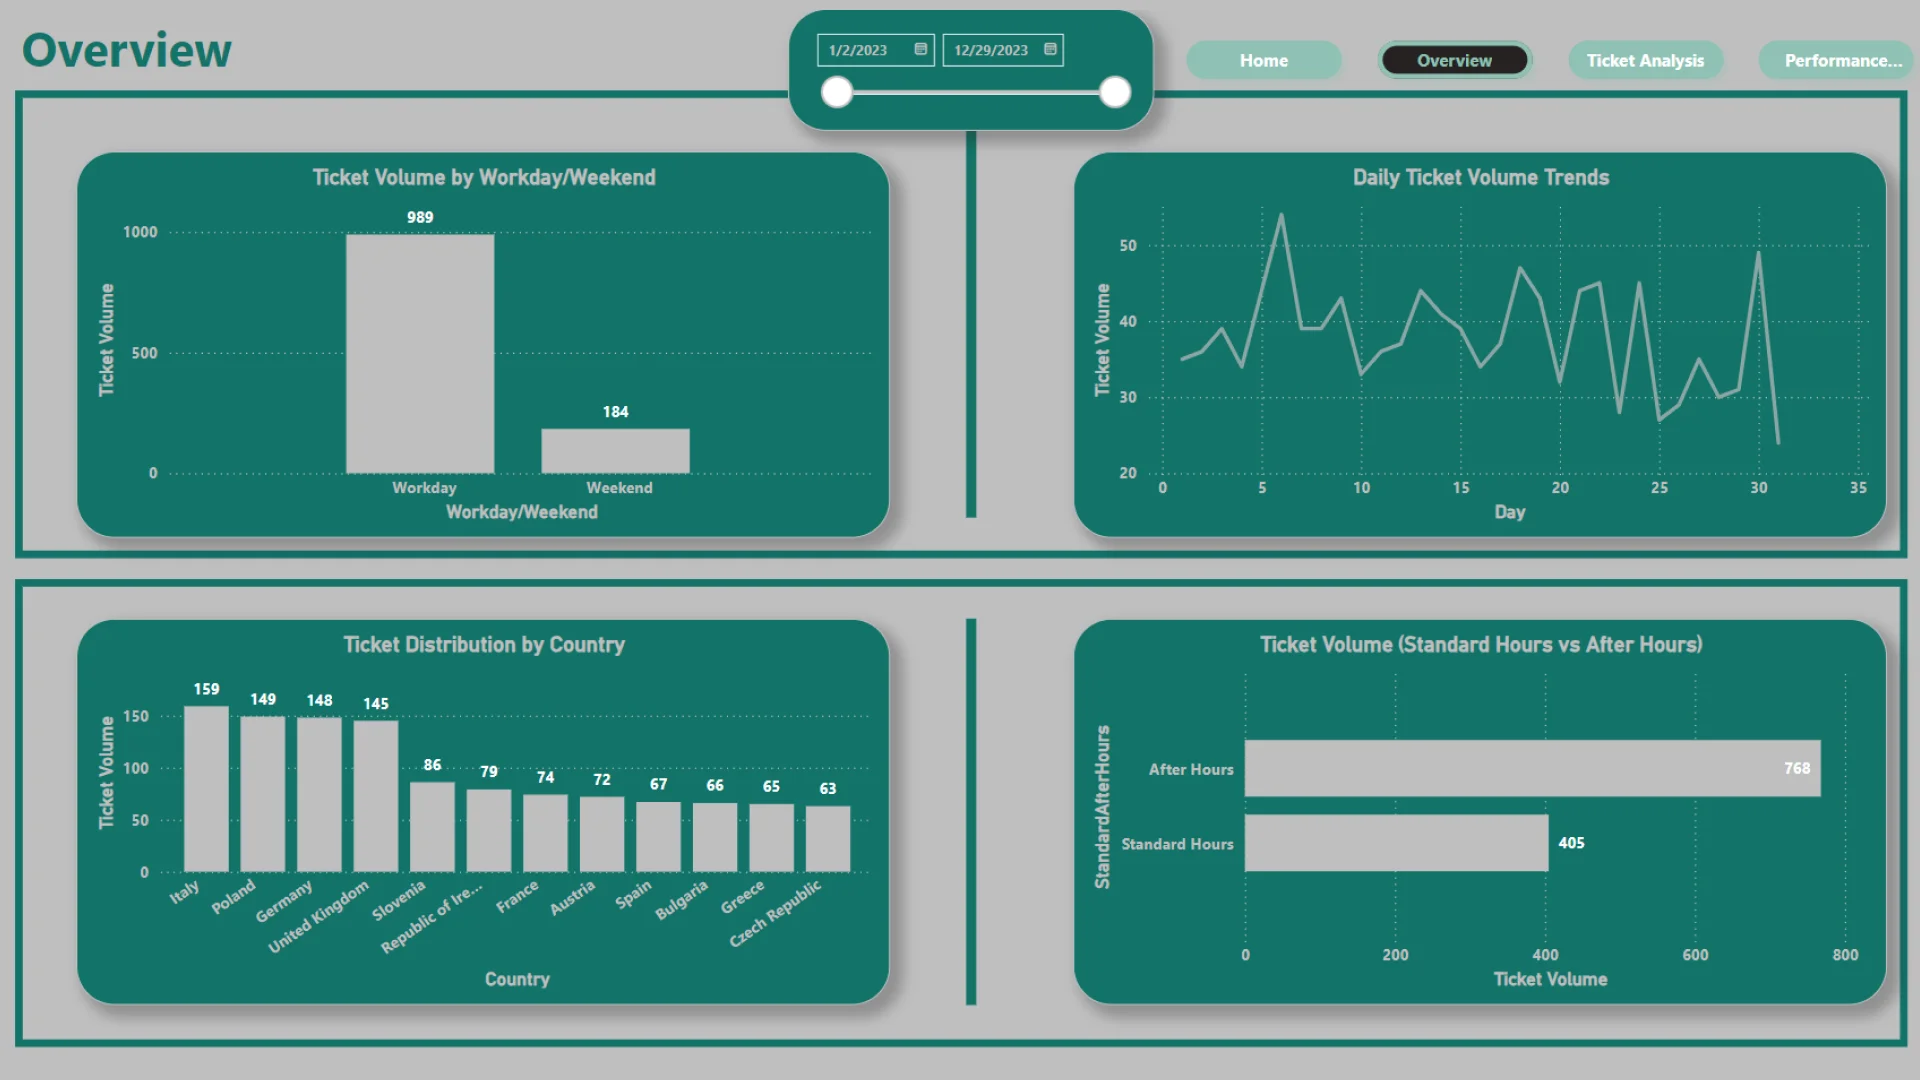
📊 Overview: Get a bird's eye view of daily ticket volume trends, distribution by workday/weekend, and ticket volume analysis based on standard hours vs after hours.
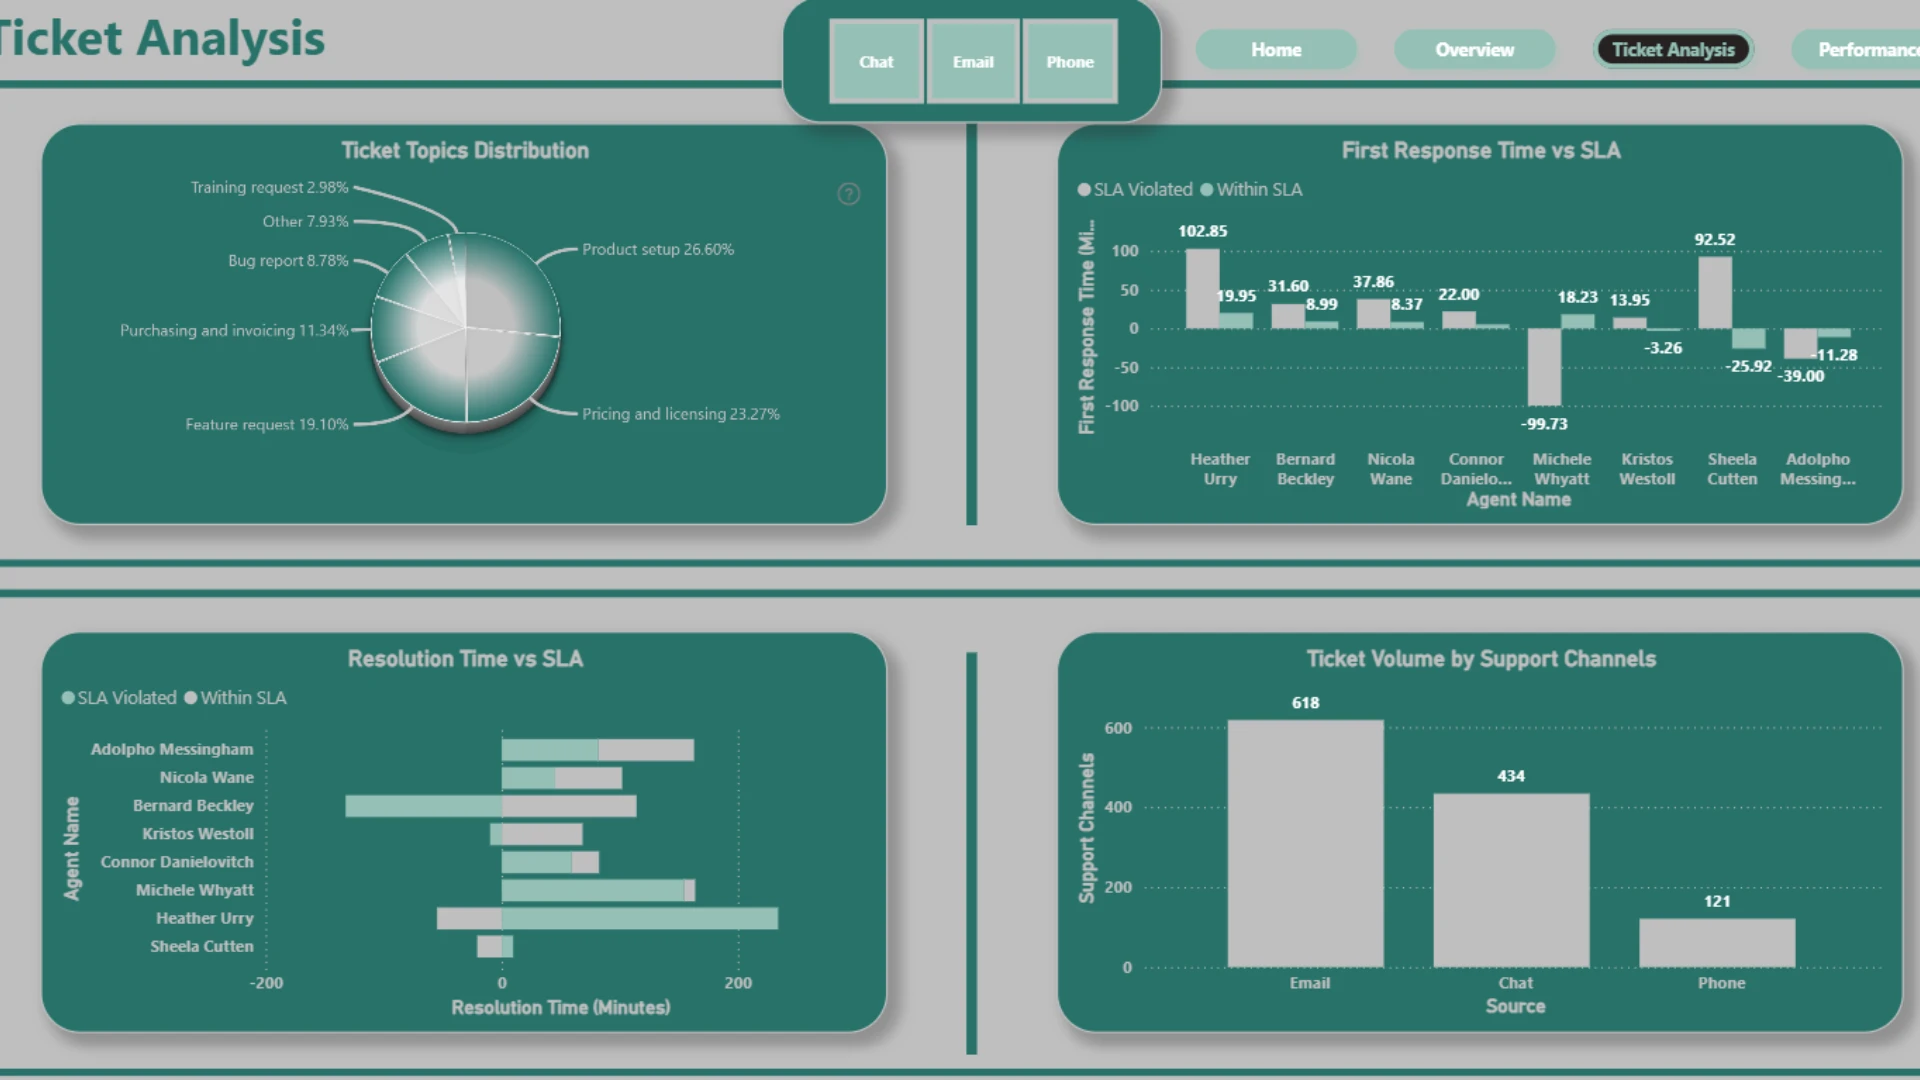
🔍 Ticket Analysis: Explore deeper into ticket topics distribution, first response time vs SLA, and ticket volume by support channels.
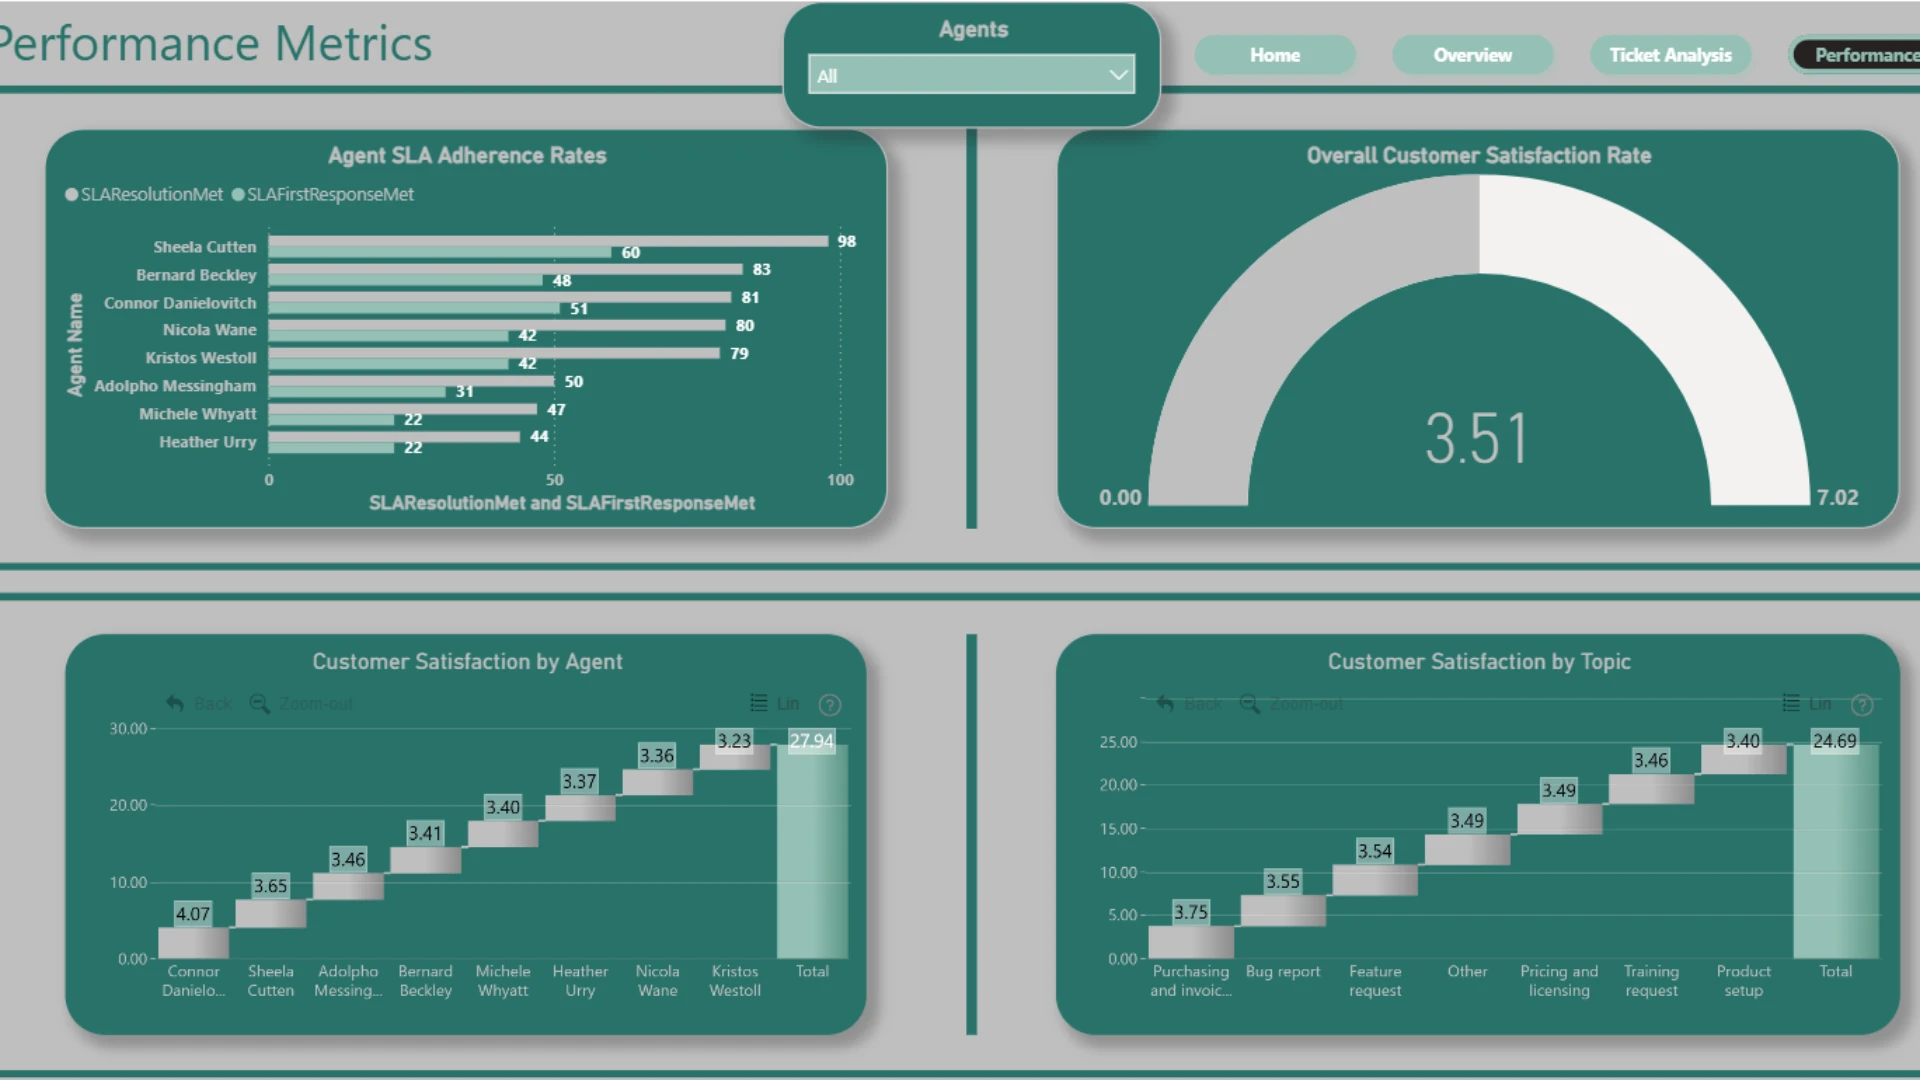
📈 Performance Metrics: Evaluate agent SLA adherence rates, overall customer satisfaction rate, and detailed breakdowns of customer satisfaction by agent and topic.


4U Report Challenges
Participate in data challenges, build and submit reports to get free template downloads.
Join CommunityMobile view allows you to interact with the report. To Download the template please switch to desktop view.



How to use a PBIX template
Preview the interactive report, download the PBIX file, open it in Power BI Desktop, and replace the same data connection with your own dataset.
Preview and download
Explore the report online and download the PBIX template file.
Open in Power BI Desktop
Open the downloaded PBIX file in Power BI Desktop.
Connect your data
Replace the sample data source with your own dataset.
Refresh and adjust
Refresh the model and update fields or visual were needed.
Save and share
Save your report and publish it for your audience.


