2309
CRM & Sales Pipeline Power BI Dashboard
CRM & Sales Pipeline Power BI Dashboard
More Report pages
Report Author: Agata Filawska
2309
Share template with others
Power BI CRM & Sales Pipeline Dashboard
An interactive Power BI dashboard example for monitoring customer relationships, sales performance, pipeline activity, and growth opportunities.
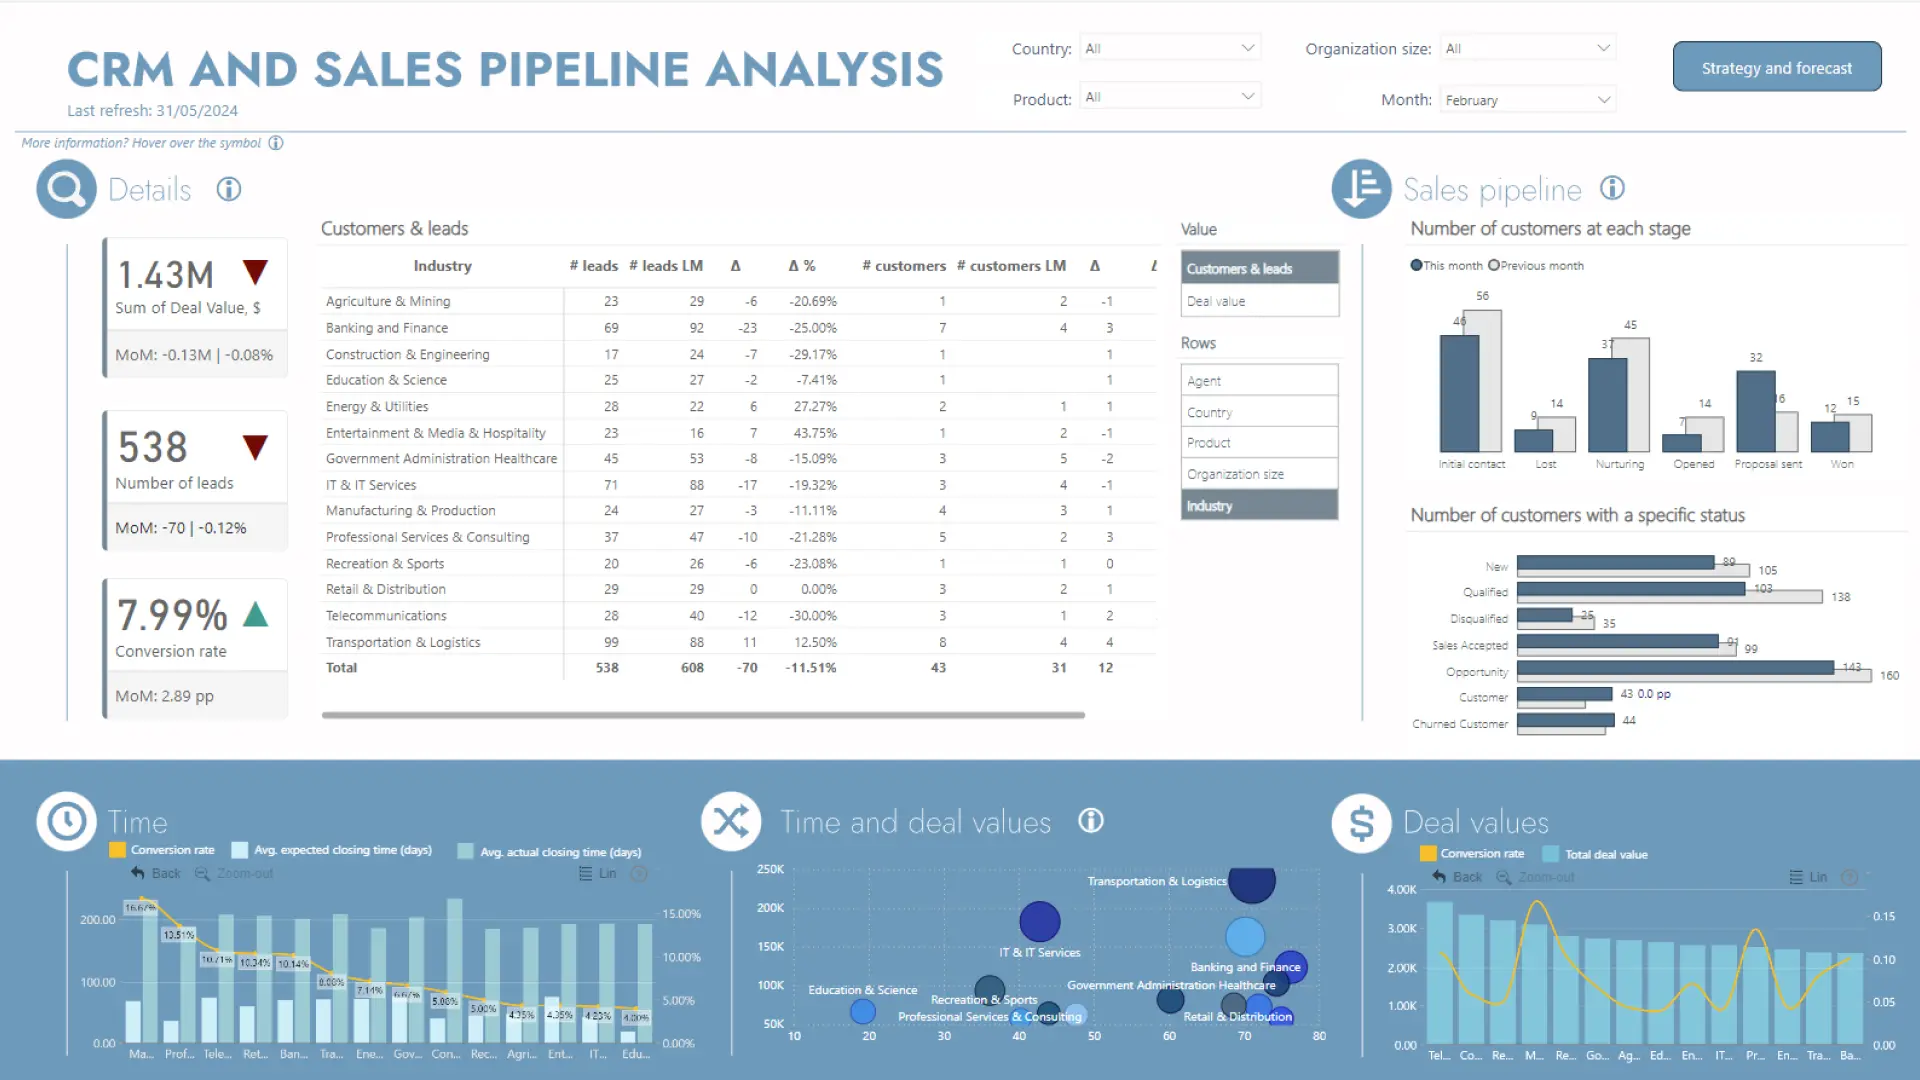
This CRM & Sales Pipeline Power BI dashboard helps sales teams, CRM managers, and business analysts monitor customer relationships, evaluate sales performance, and uncover opportunities for growth. Built using the CRM & Sales Pipeline Analysis dataset from the FP20 Analytics July 2024 Challenge, this report demonstrates how advanced data visualization can turn complex customer and sales information into actionable business insights.
The dashboard combines multiple ZoomCharts custom visuals for Power BI, including Drill Down Combo PRO, Drill Down Timeline PRO, and Drill Down Waterfall PRO. Interactive drill-down capabilities make it easy to move from high-level performance overviews to detailed customer and pipeline analysis.
Key Insights of This Power BI CRM Dashboard
Sales Pipeline Visibility
Track pipeline activity, sales opportunities, deal progress, and performance across different stages.
Customer Relationship Analysis
Monitor customer engagement, account activity, and relationship trends over time.
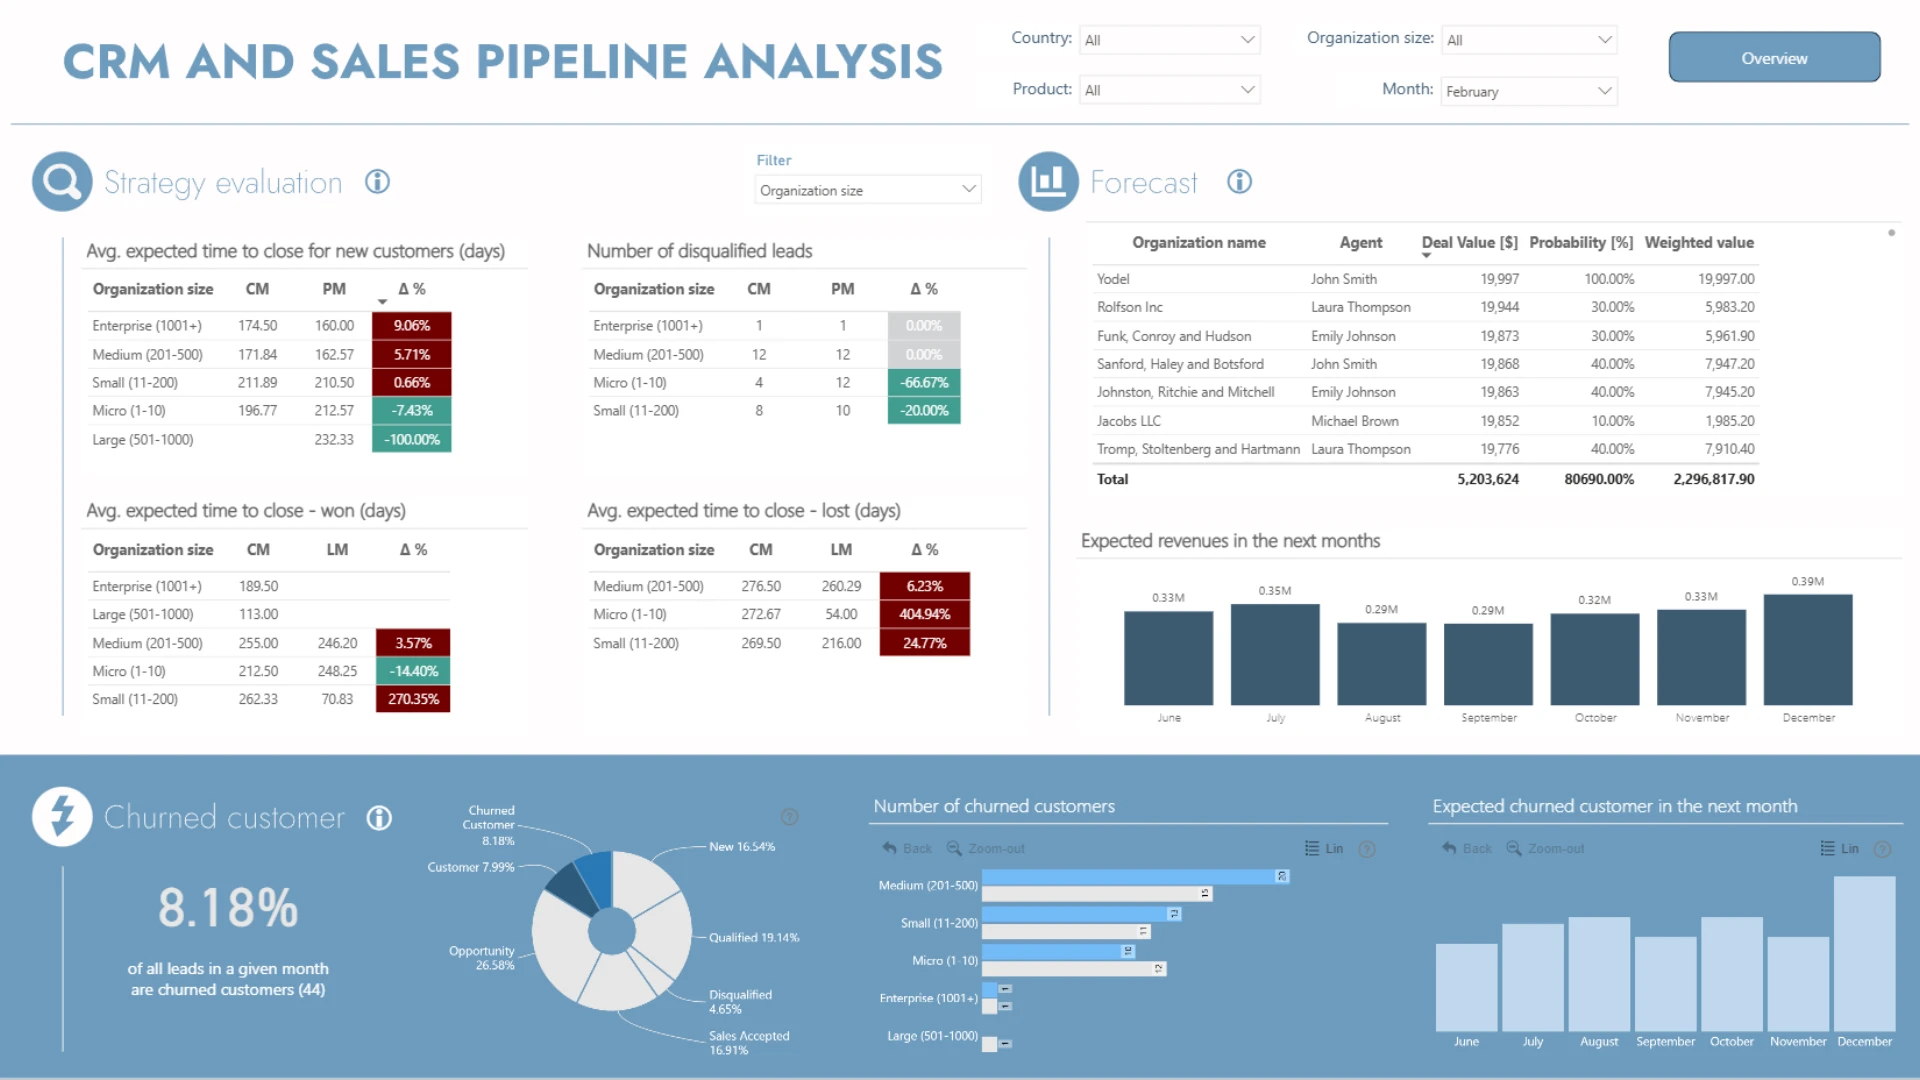
Sales Performance Monitoring
Evaluate sales KPIs, identify performance patterns, and compare results across segments and periods.
Growth Opportunity Discovery
Uncover trends, high-potential opportunities, and factors that influence sales outcomes.
Why This Report Is Useful
Dynamic filtering, cross-visual interactions, and drill-down navigation provide a seamless analytical experience. Users can discover patterns, compare performance, investigate business drivers, and make better sales management decisions.
How to Use This CRM & Sales Pipeline Dashboard
Drill into performance
Move from executive-level sales KPIs to detailed customer and pipeline analysis.
Compare segments
Analyze customers, sales opportunities, time periods, and business segments.
Find sales drivers
Investigate the factors behind sales outcomes, pipeline movement, and customer engagement.
Dashboard Highlights
This CRM dashboard example showcases Power BI best practices for building data-driven sales and customer analytics solutions. It demonstrates how interactive visuals can improve decision-making, increase transparency, and support more effective sales management.
4U Report Challenges
Participate in data challenges, build and submit reports to get free template downloads.
Join CommunityMobile view allows you to interact with the report. To Download the template please switch to desktop view.

Was this helpful? Thank you for your feedback!
Sorry about that.
How can we improve it?