1057
Credit Risk KPI Dashboard for Banking
Credit Risk KPI Dashboard for Banking
More Report pages
Report Author: Justin Tracy Manzano
1057
Share template with others
This Credit Risk KPI Dashboard for Banking helps users monitor credit risk KPIs, loan portfolio health, borrower risk, and banking performance indicators.
This Power BI report uses the Credit Bank Risk Dataset and features ZoomCharts Drill Down PRO custom visuals for Power BI. It was submitted to the Onyx Data DataDNA ZoomCharts Mini Challenge in September 2025.
Author's Description:
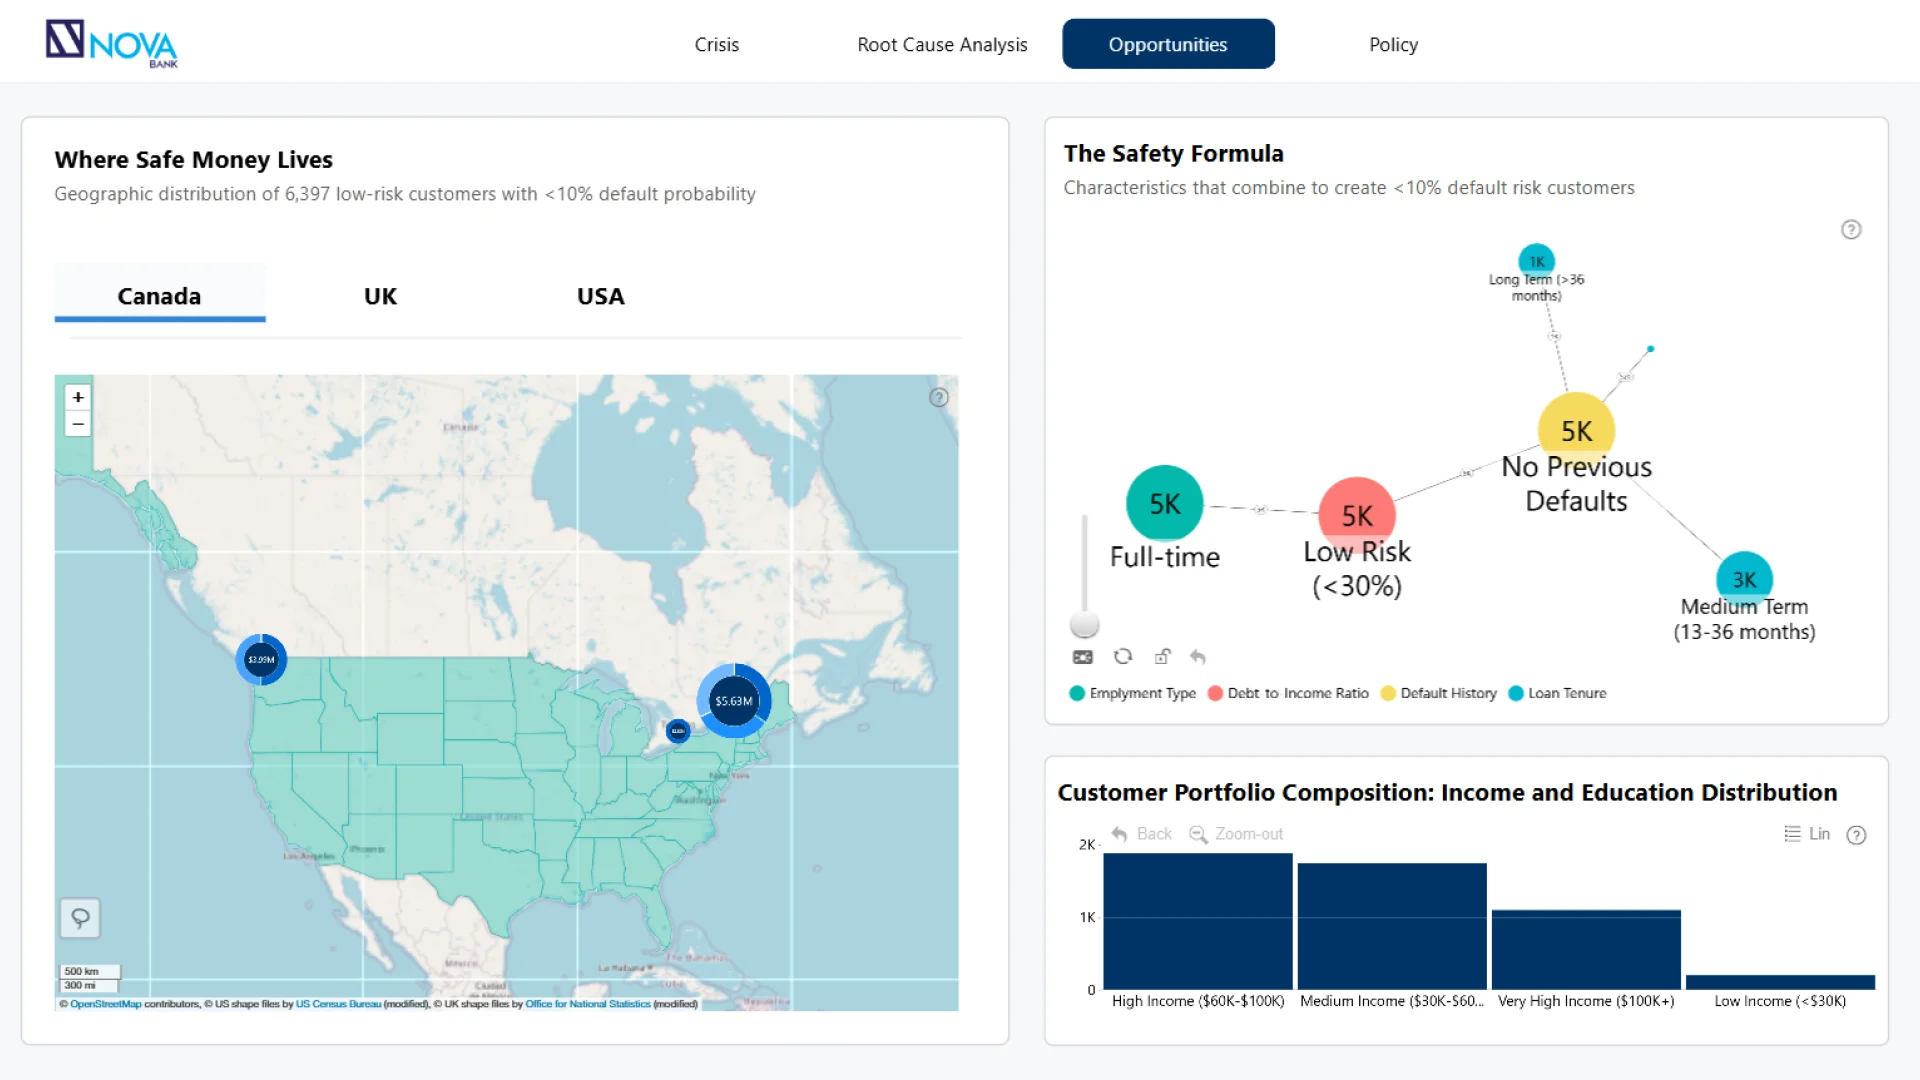
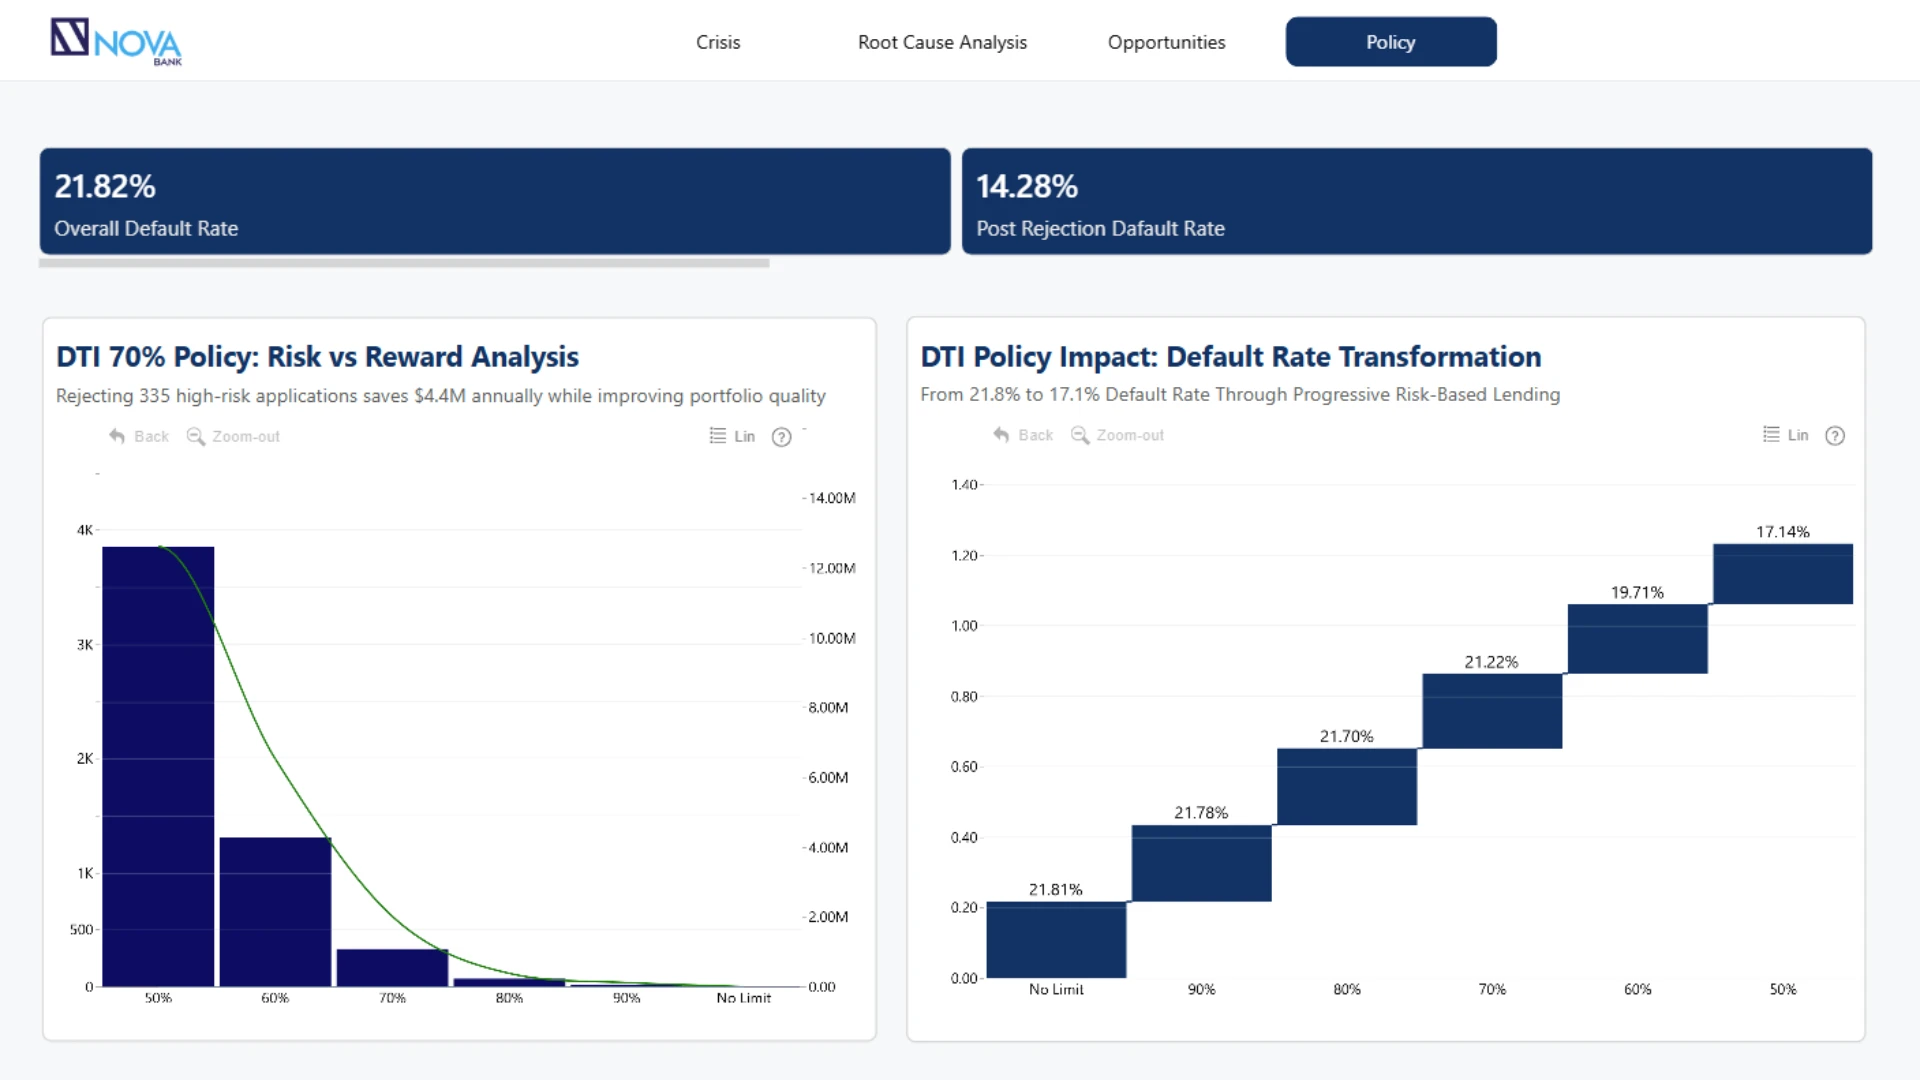
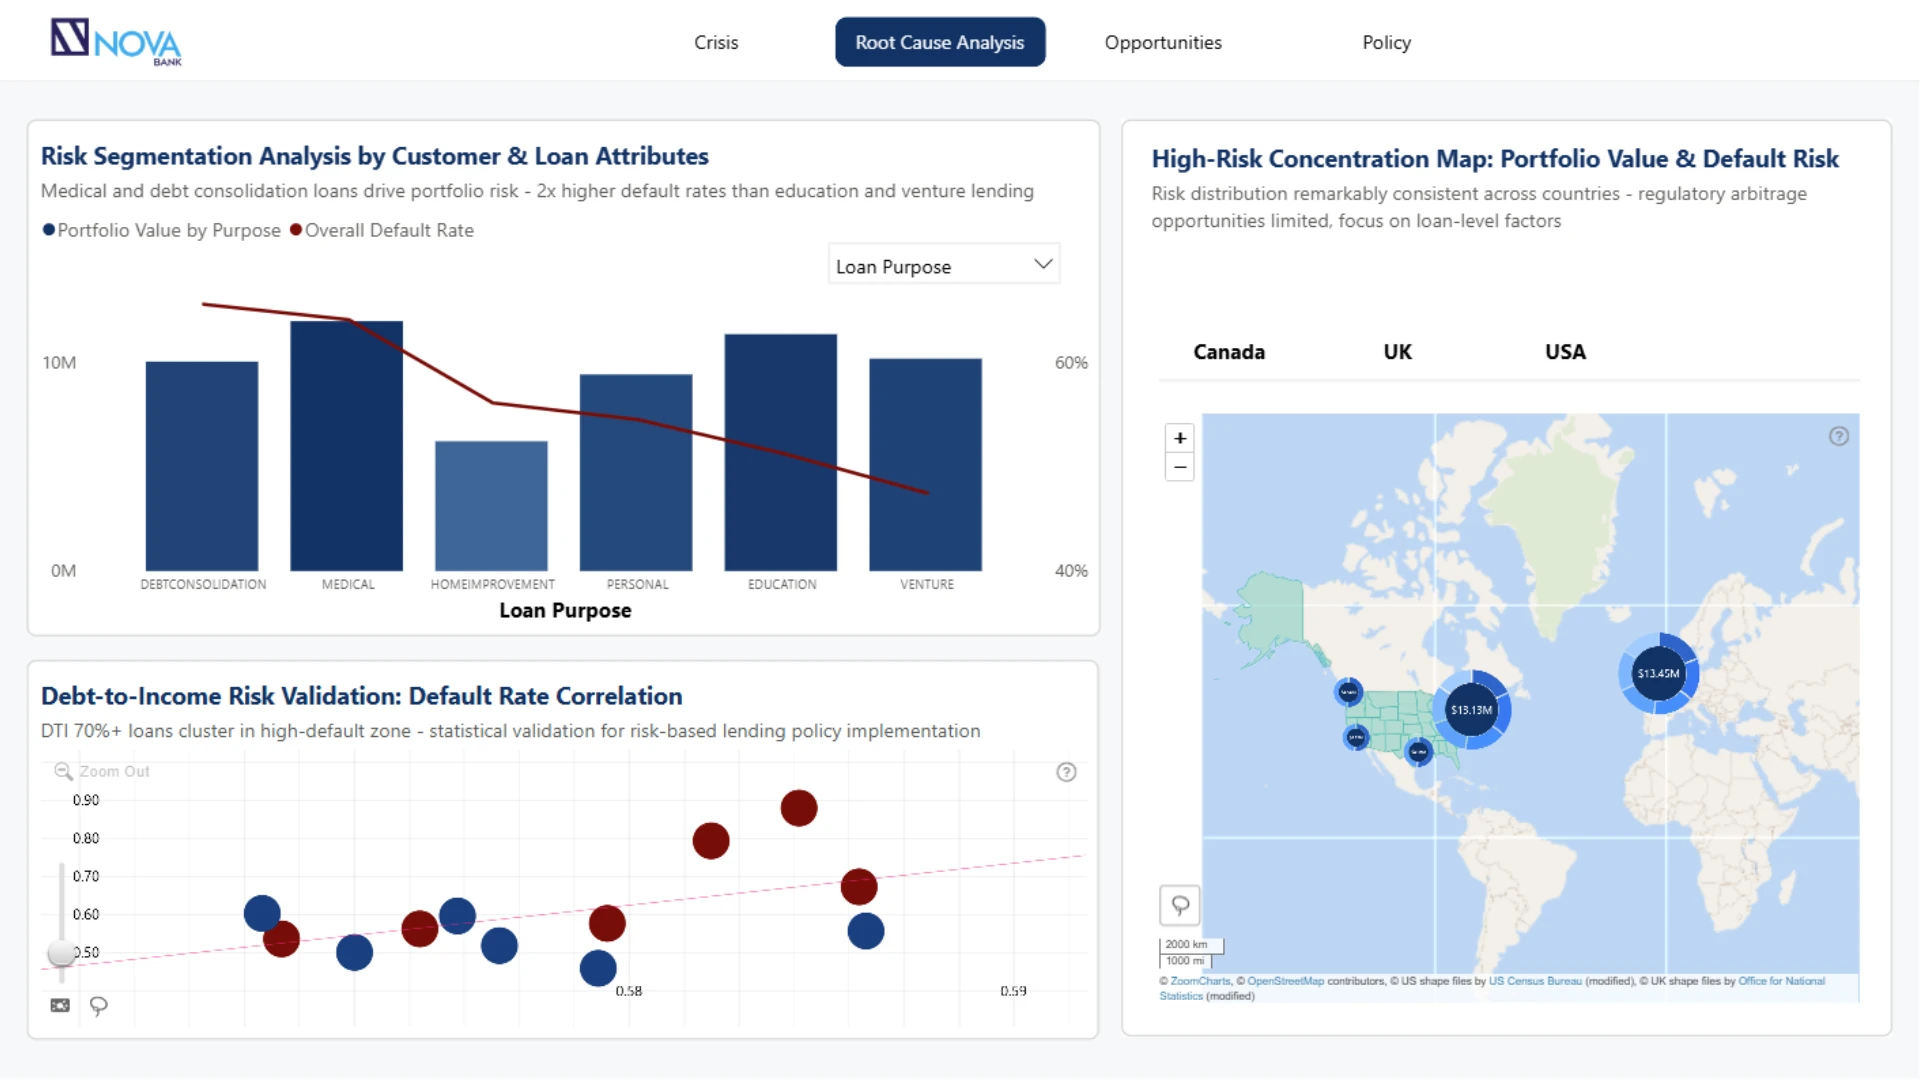
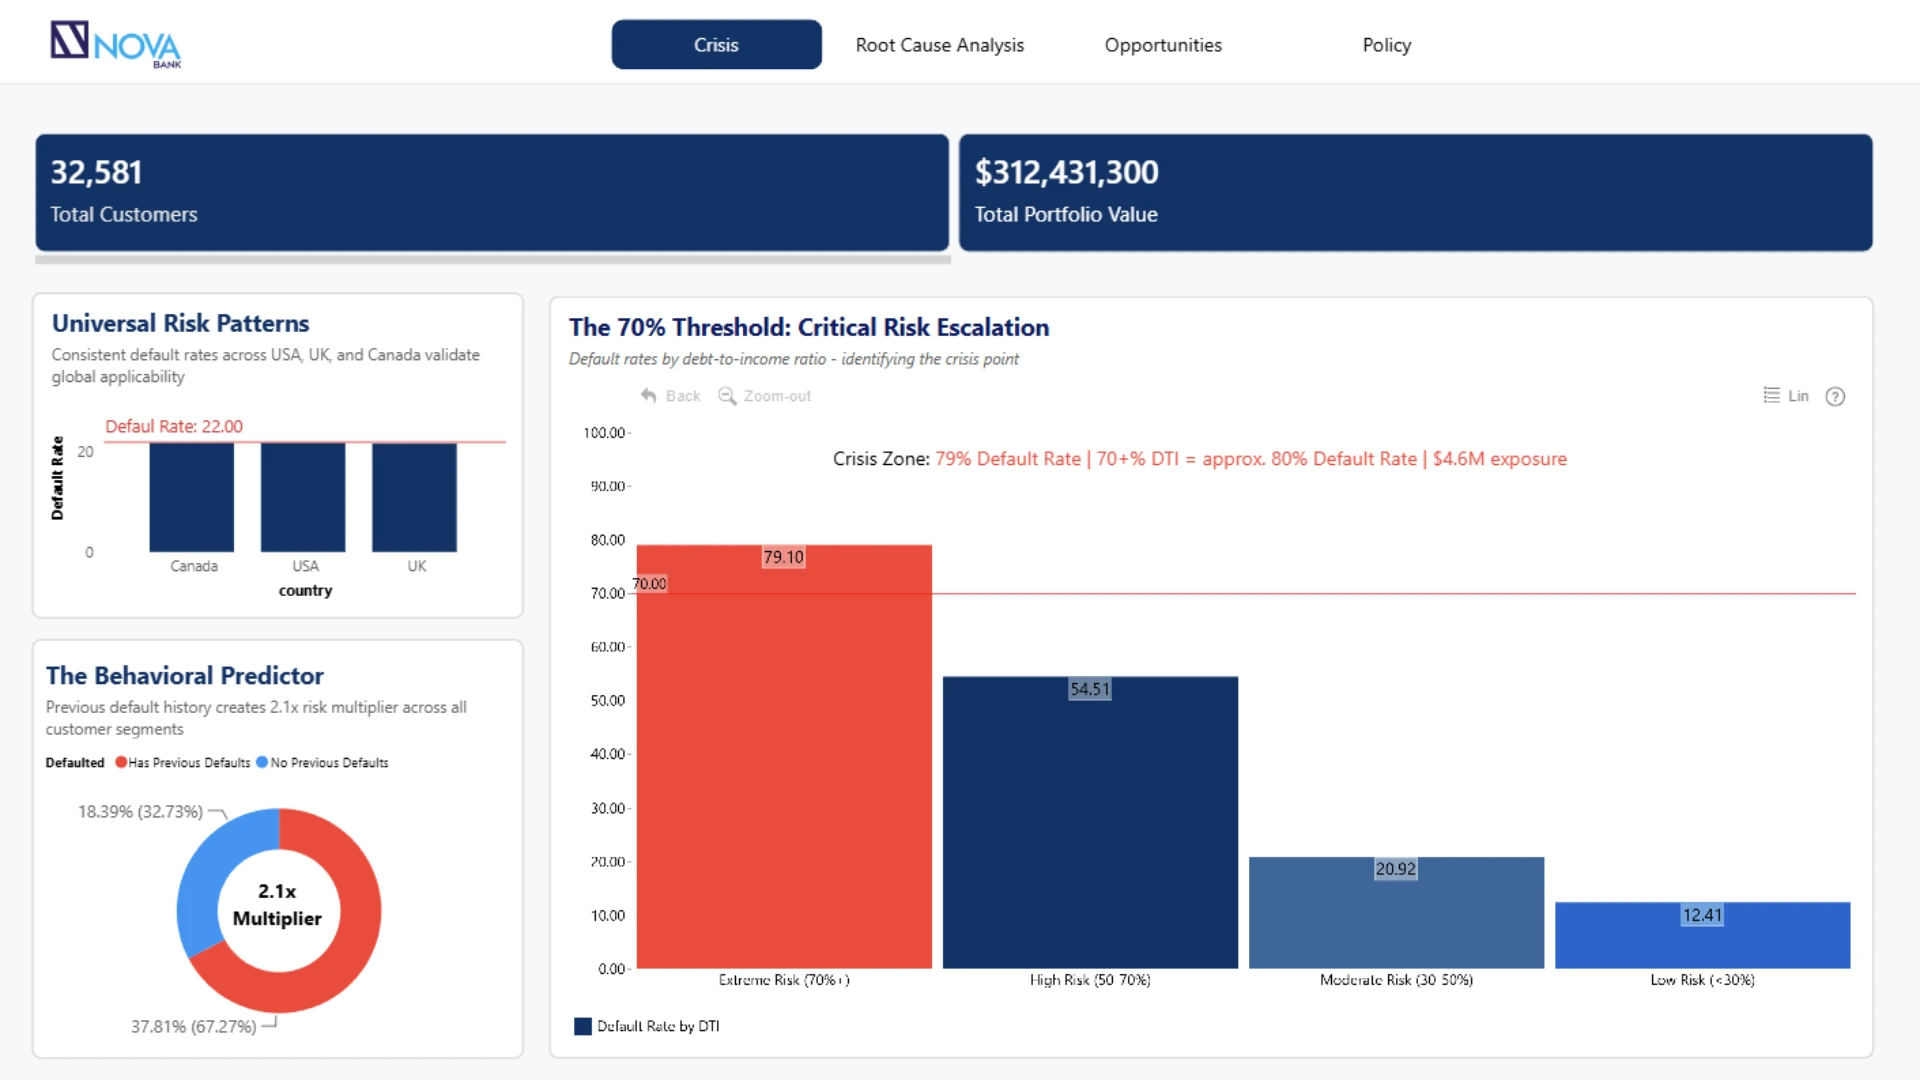
Nova Bank’s portfolio analysis uncovered a hidden crisis: just 1% of loans (335 accounts) carried a staggering 79% default rate due to high Debt-to-Income ratios (≥70%), far exceeding the overall 21.9% default rate. Advanced Power BI dashboards with real-time simulation, geographic risk mapping, and interactive segmentation revealed that debt consolidation and medical loans posed the highest risks. By implementing a DTI threshold at 70%, Nova Bank can prevent 265 annual defaults, improve portfolio quality, and unlock $4.4M in annual net benefit with minimal disruption. This solution not only mitigates risk but also delivers scalable, data-driven decision support, strengthening both compliance and competitive advantage.
ZoomCharts visuals used





4U Report Challenges
Participate in data challenges, build and submit reports to get free template downloads.
Join CommunityMobile view allows you to interact with the report. To Download the template please switch to desktop view.
How to use a PBIX template
Preview the interactive report, download the PBIX file, open it in Power BI Desktop, and replace the same data connection with your own dataset.
Preview and download
Explore the report online and download the PBIX template file.
Open in Power BI Desktop
Open the downloaded PBIX file in Power BI Desktop.
Connect your data
Replace the sample data source with your own dataset.
Refresh and adjust
Refresh the model and update fields or visual were needed.
Save and share
Save your report and publish it for your audience.


