1128
Credit Risk and Loan Performance Dashboard
Credit Risk and Loan Performance Dashboard
More Report pages
Report Author: Jessica Herrera Perdomo
1128
Share template with others
This Power BI report is based on the Credit Bank Risk Dataset and was submitted to the Onyx Data DataDNA ZoomCharts Mini Challenge in September 2025.
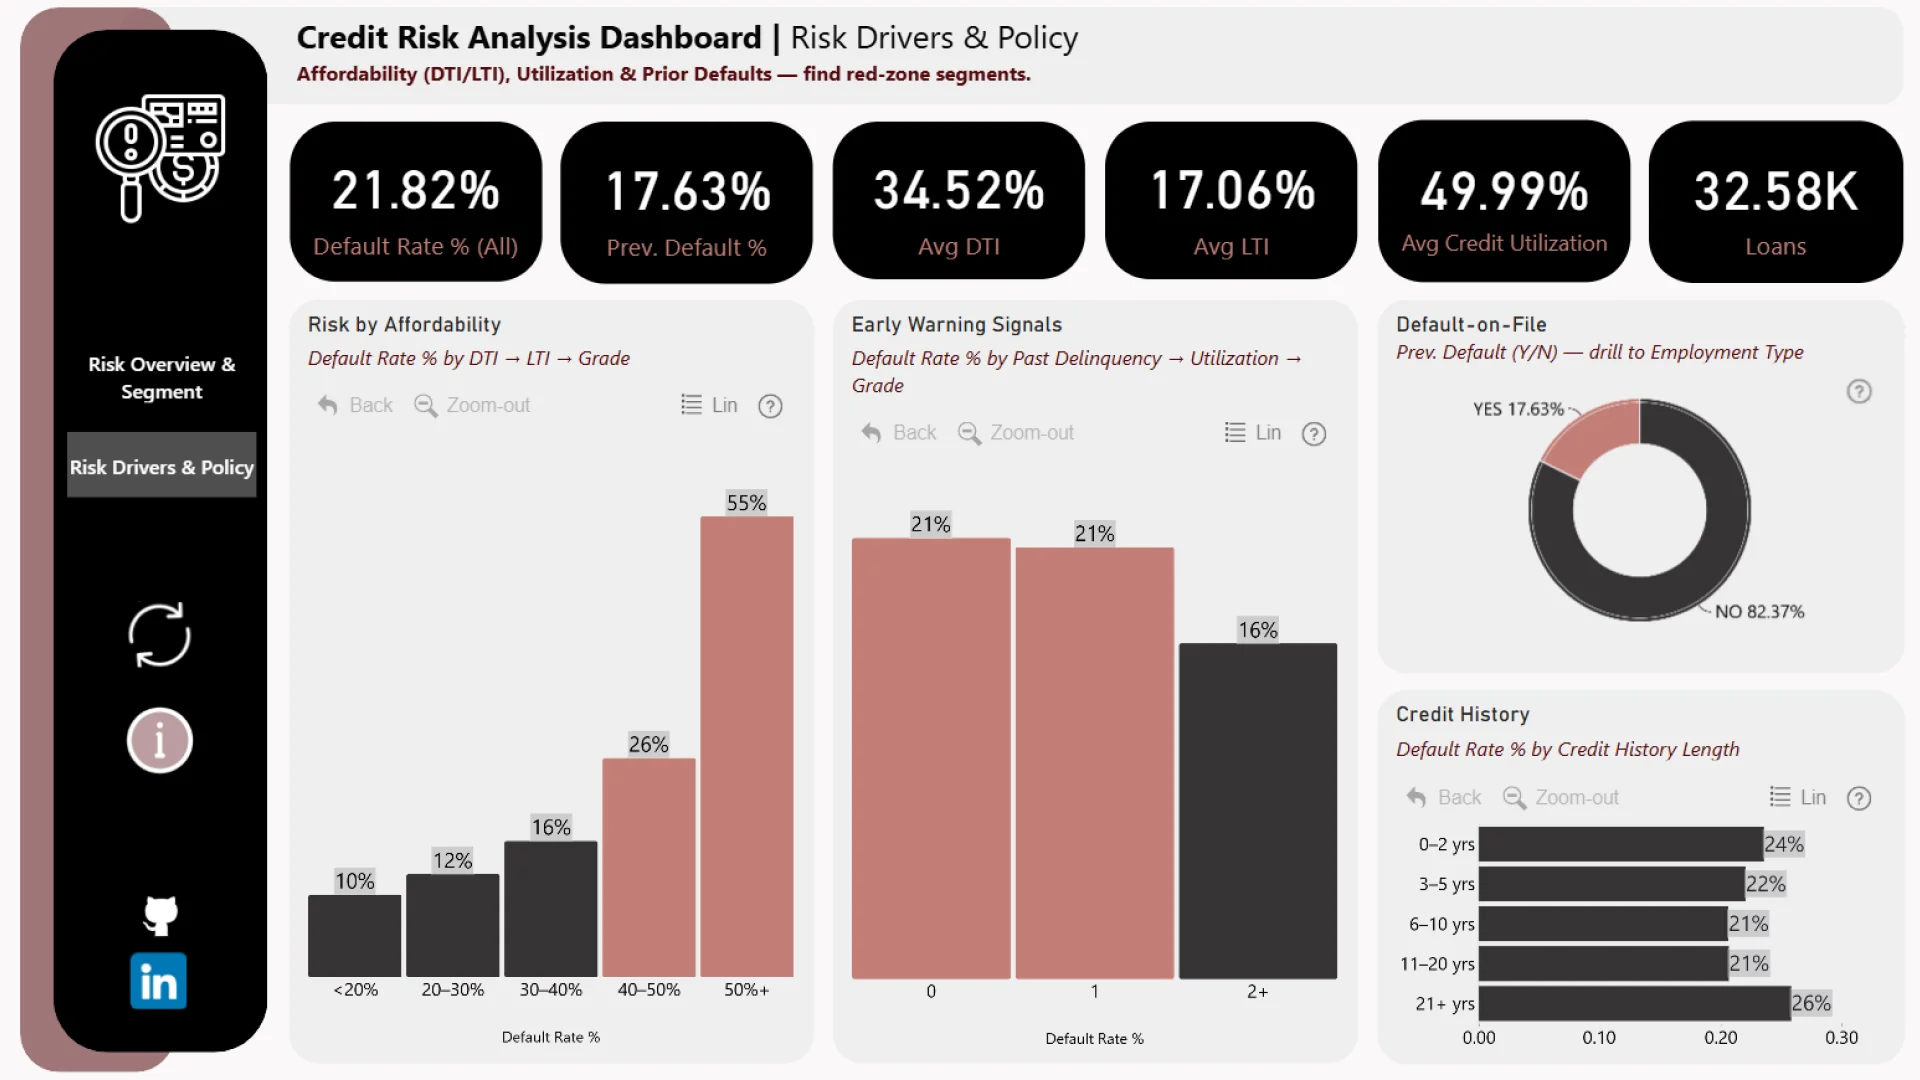
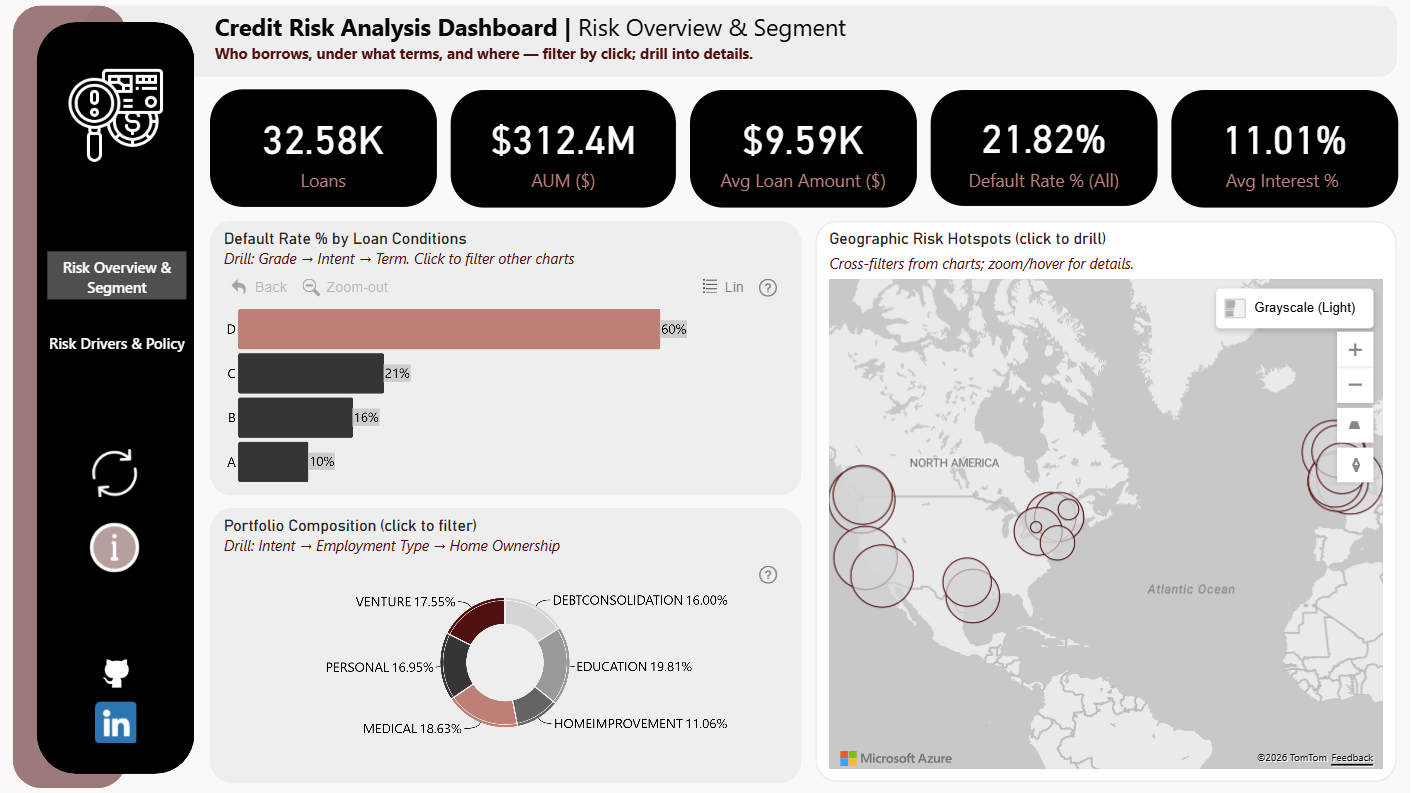
The Credit Risk and Loan Performance Dashboard helps users compare credit risk indicators with loan performance trends across a banking portfolio. It provides an interactive view of borrower characteristics, loan composition, and default patterns, making it easier to identify high-risk segments and understand the factors driving loan performance.
The dashboard enables users to explore these patterns through interactive drill-down analysis, including Grade → Loan Intent → Loan Term and DTI → LTI → Grade hierarchies. Additional visualizations include a multi-level breakdown of Loan Intent, Employment Length, and Home Ownership, as well as geographic mapping that highlights regional concentrations of credit risk and loan defaults.



4U Report Challenges
Participate in data challenges, build and submit reports to get free template downloads.
Join CommunityMobile view allows you to interact with the report. To Download the template please switch to desktop view.
How to use a PBIX template
Preview the interactive report, download the PBIX file, open it in Power BI Desktop, and replace the same data connection with your own dataset.
Preview and download
Explore the report online and download the PBIX template file.
Open in Power BI Desktop
Open the downloaded PBIX file in Power BI Desktop.
Connect your data
Replace the sample data source with your own dataset.
Refresh and adjust
Refresh the model and update fields or visual were needed.
Save and share
Save your report and publish it for your audience.


