1085
Consumer Complaints Company Benchmarking Dashboard
Consumer Complaints Company Benchmarking Dashboard
More Report pages
Report Author: Mostafa Amr
1085
Share template with others
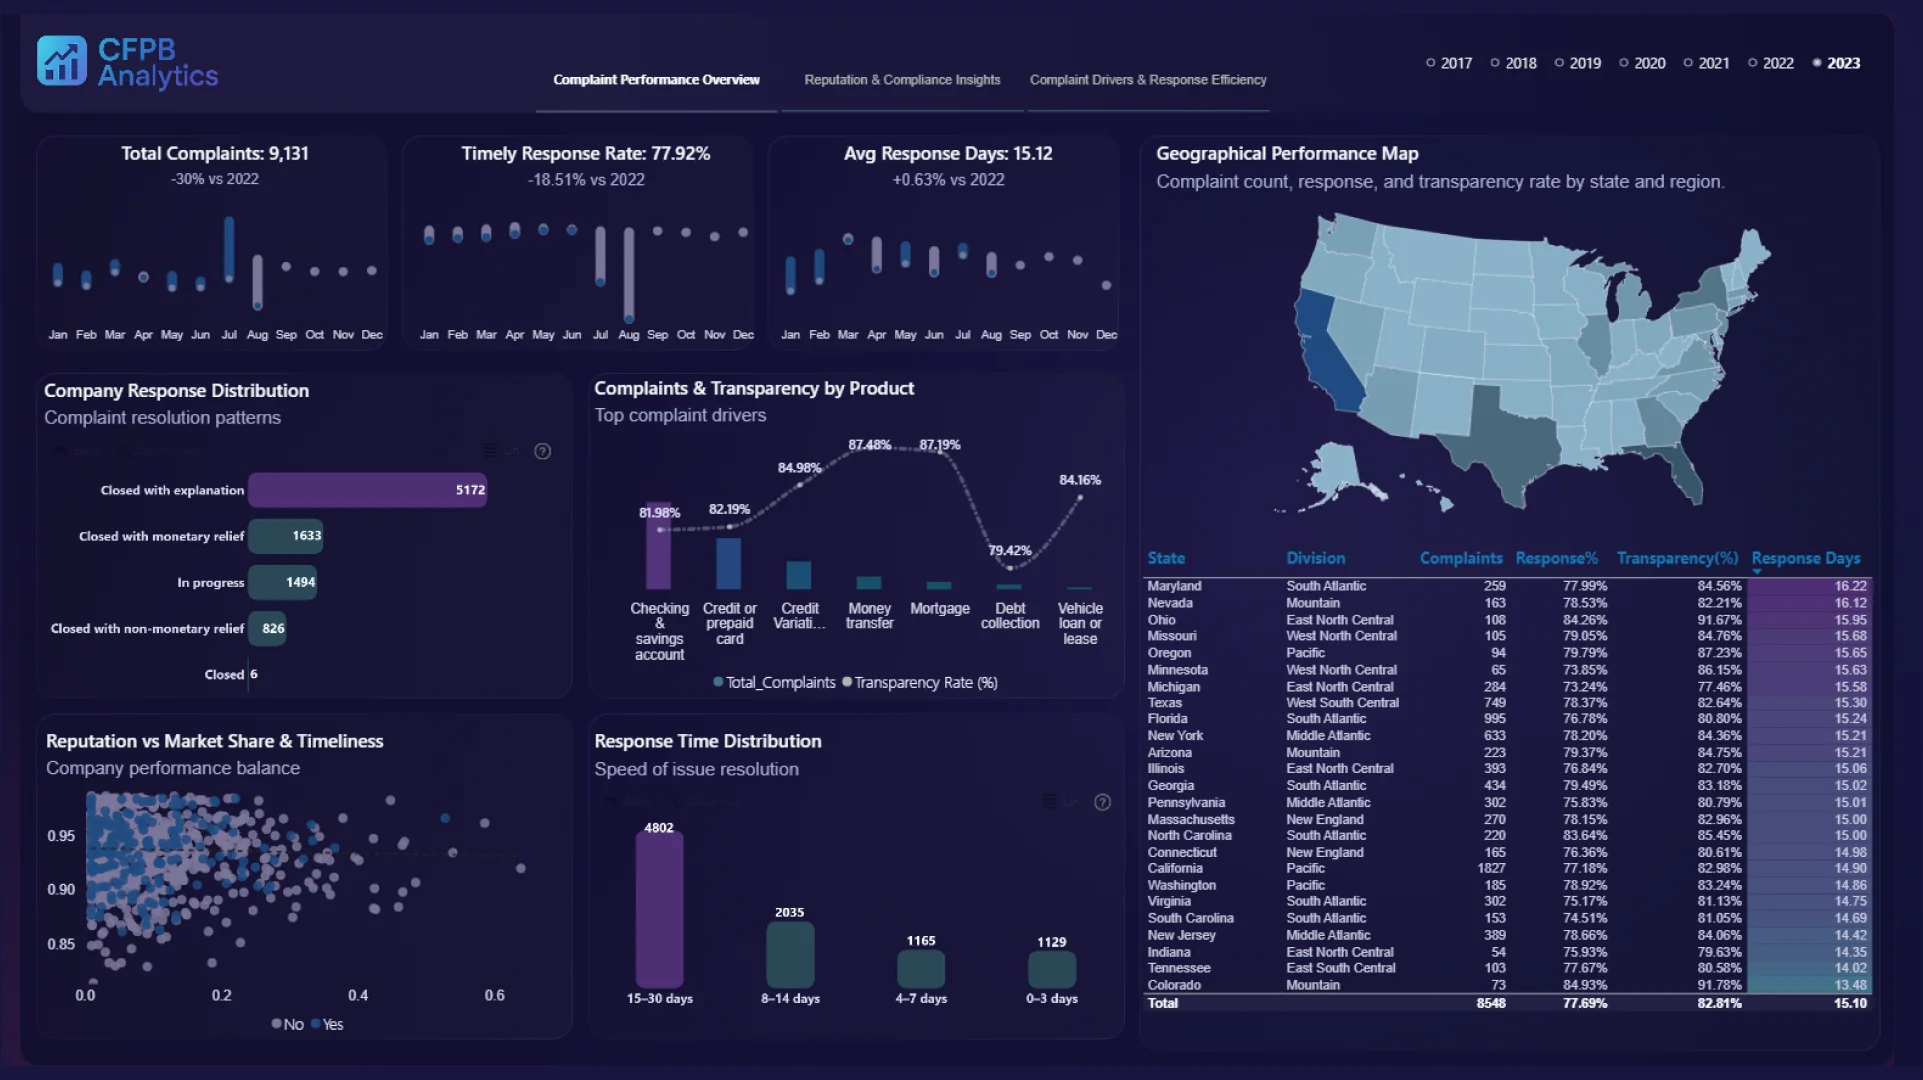
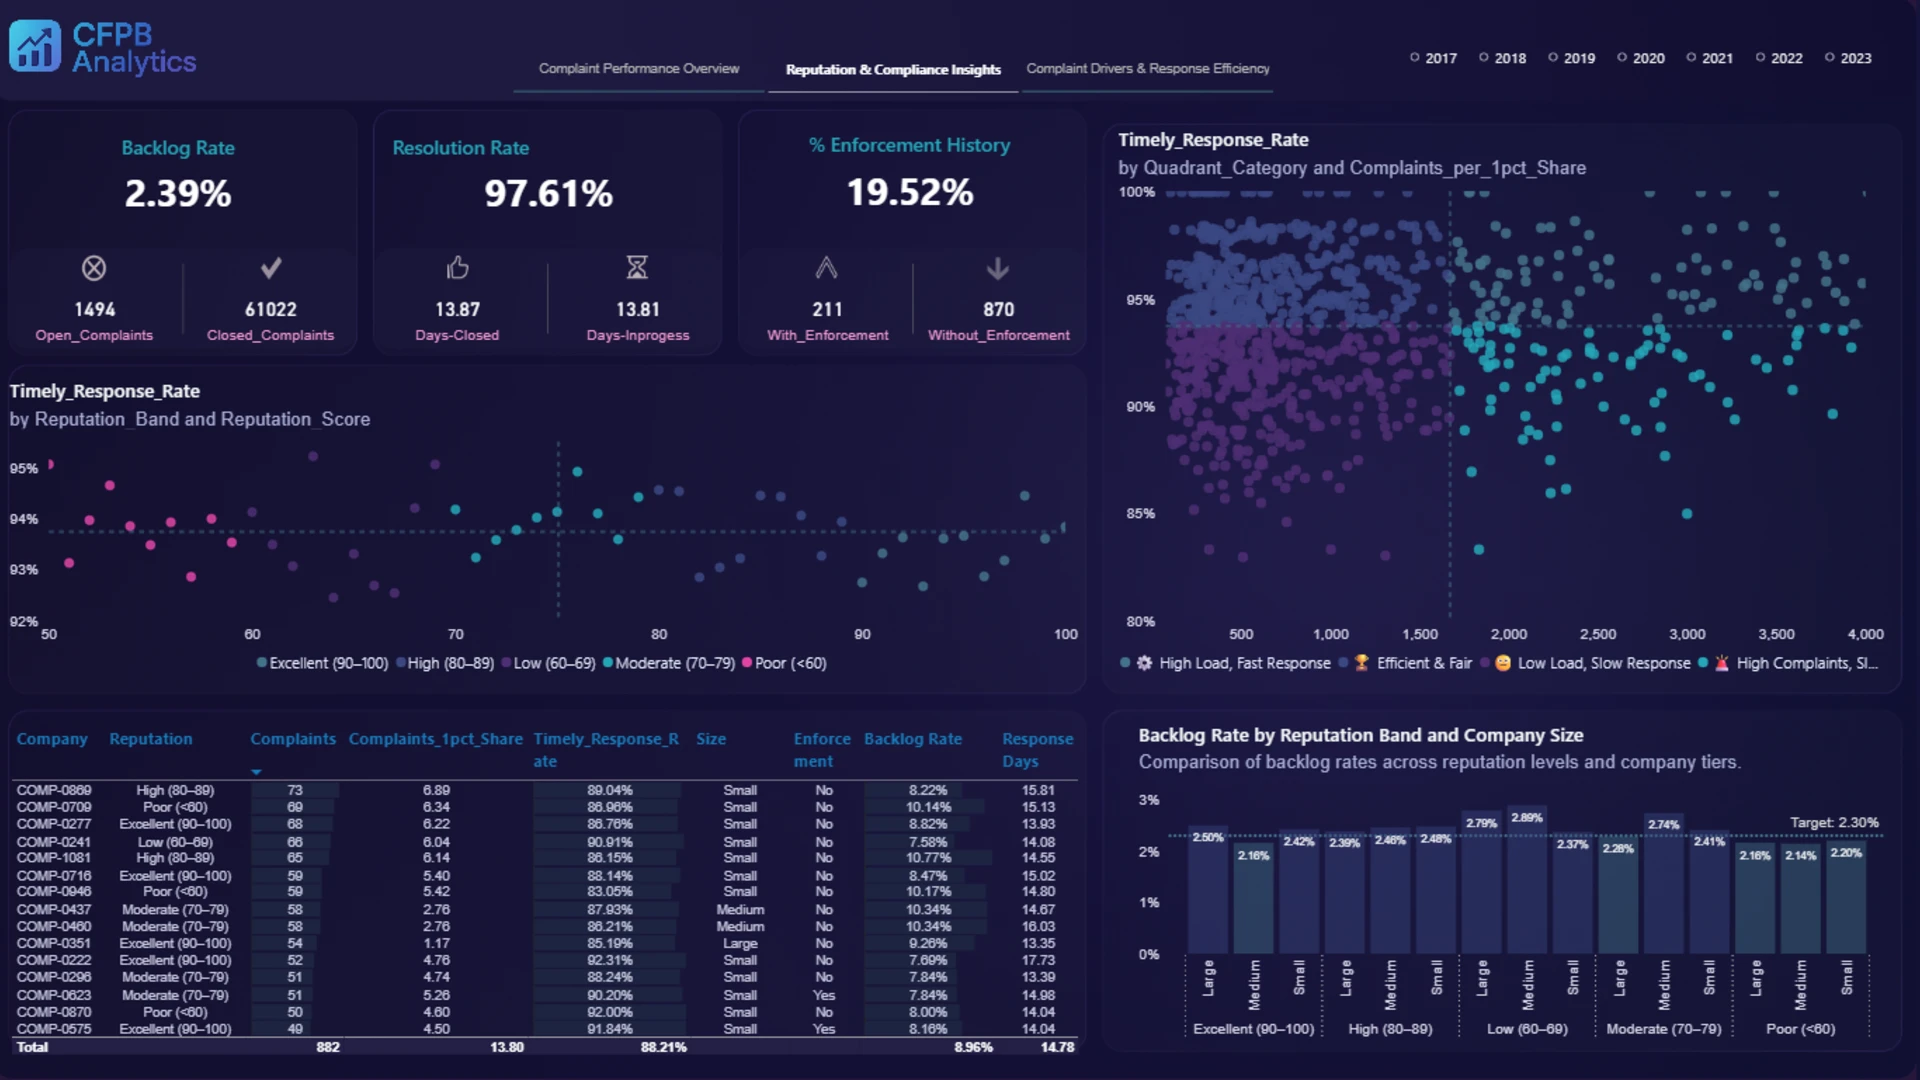
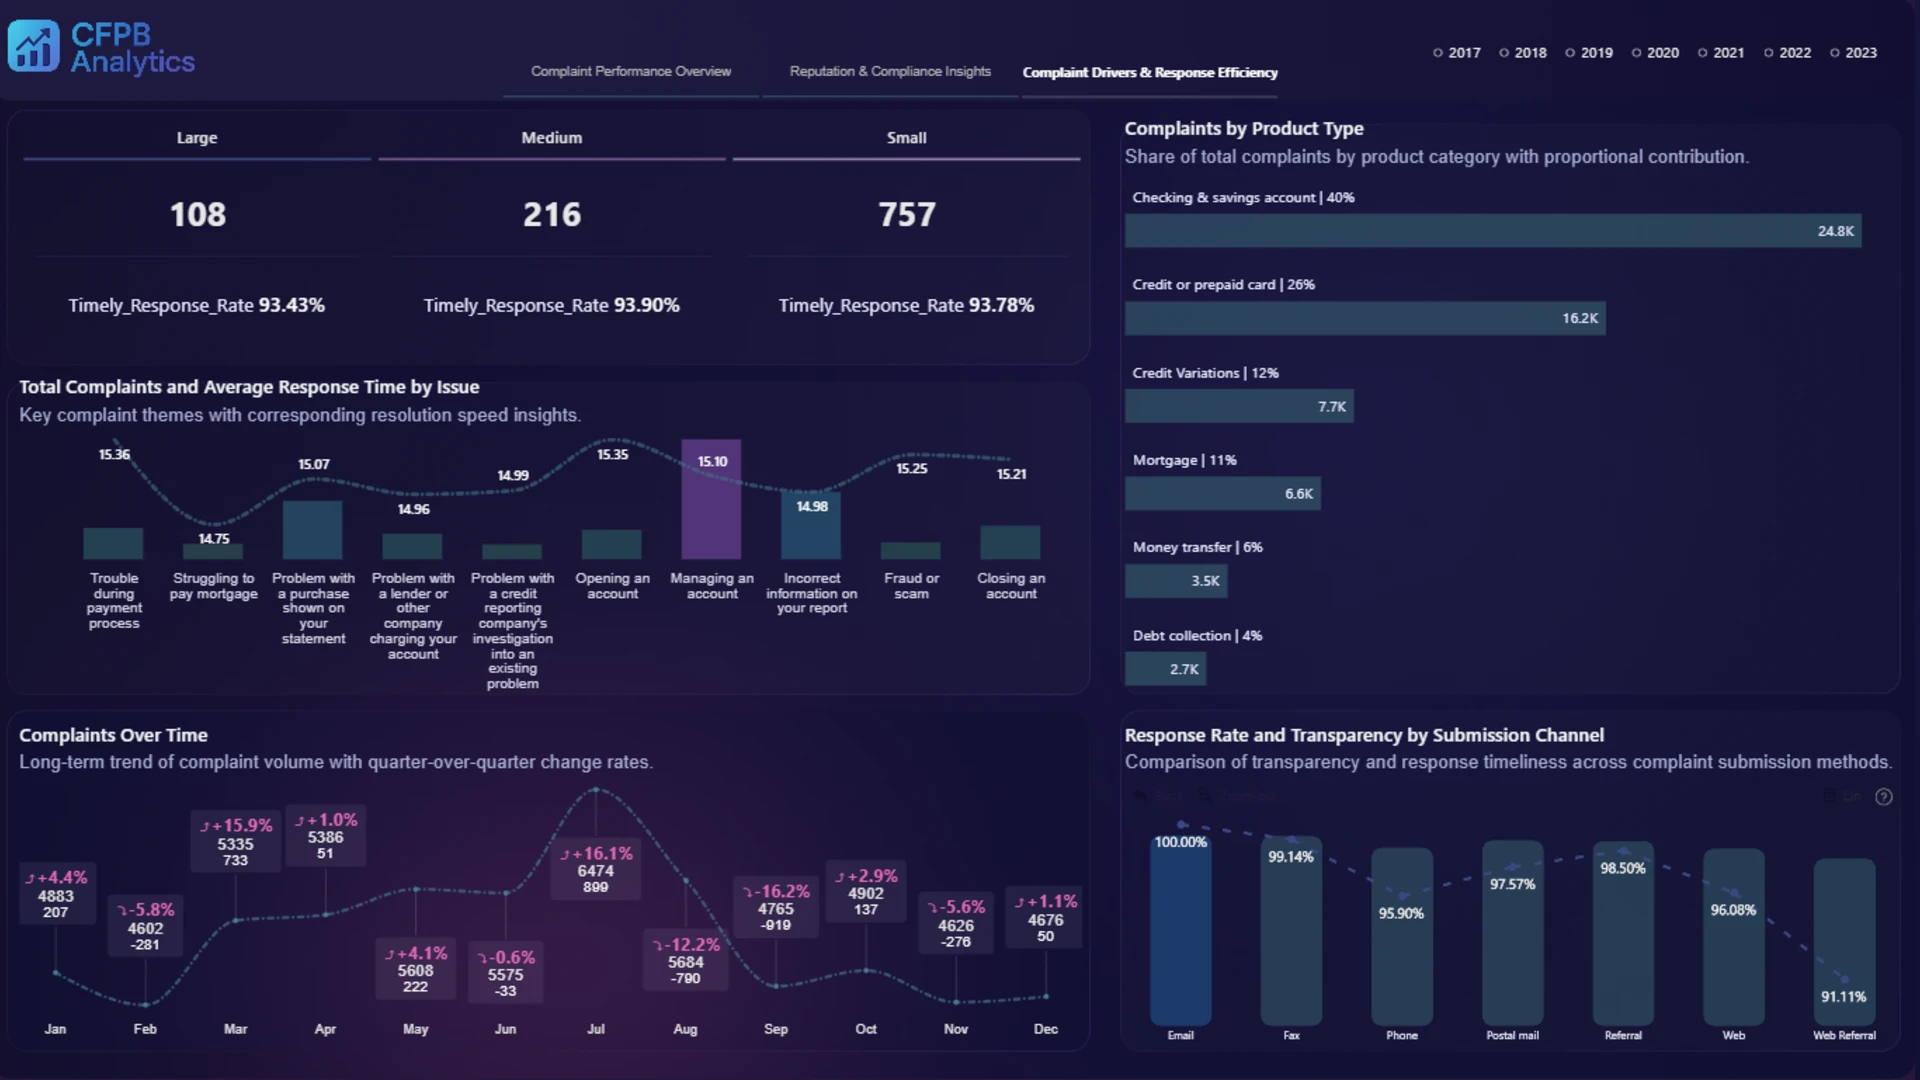
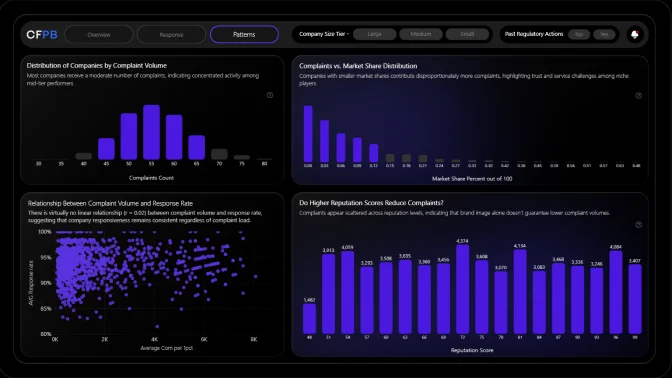
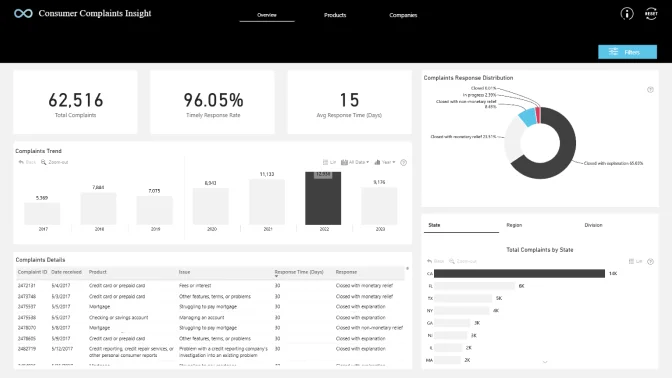
This Consumer Complaints Company Benchmarking Dashboard helps users compare complaint activity and response performance across financial service companies.
This Power BI report uses the Consumer Financial Complaints Dataset and features ZoomCharts Drill Down PRO custom visuals for Power BI. It was submitted to the Onyx Data DataDNA ZoomCharts Mini Challenge in October 2025.
Author Description:
The CFPB Analytics Dashboard Suite is a comprehensive, multi-dashboard analytics project designed to visualize and interpret consumer financial complaint data. This project transforms complex complaint datasets into clear, actionable insights that highlight organizational responsiveness, complaint trends, and performance transparency across products, companies, and regions.


4U Report Challenges
Participate in data challenges, build and submit reports to get free template downloads.
Join CommunityMobile view allows you to interact with the report. To Download the template please switch to desktop view.
How to use a PBIX template
Preview the interactive report, download the PBIX file, open it in Power BI Desktop, and replace the same data connection with your own dataset.
Preview and download
Explore the report online and download the PBIX template file.
Open in Power BI Desktop
Open the downloaded PBIX file in Power BI Desktop.
Connect your data
Replace the sample data source with your own dataset.
Refresh and adjust
Refresh the model and update fields or visual were needed.
Save and share
Save your report and publish it for your audience.


