1290
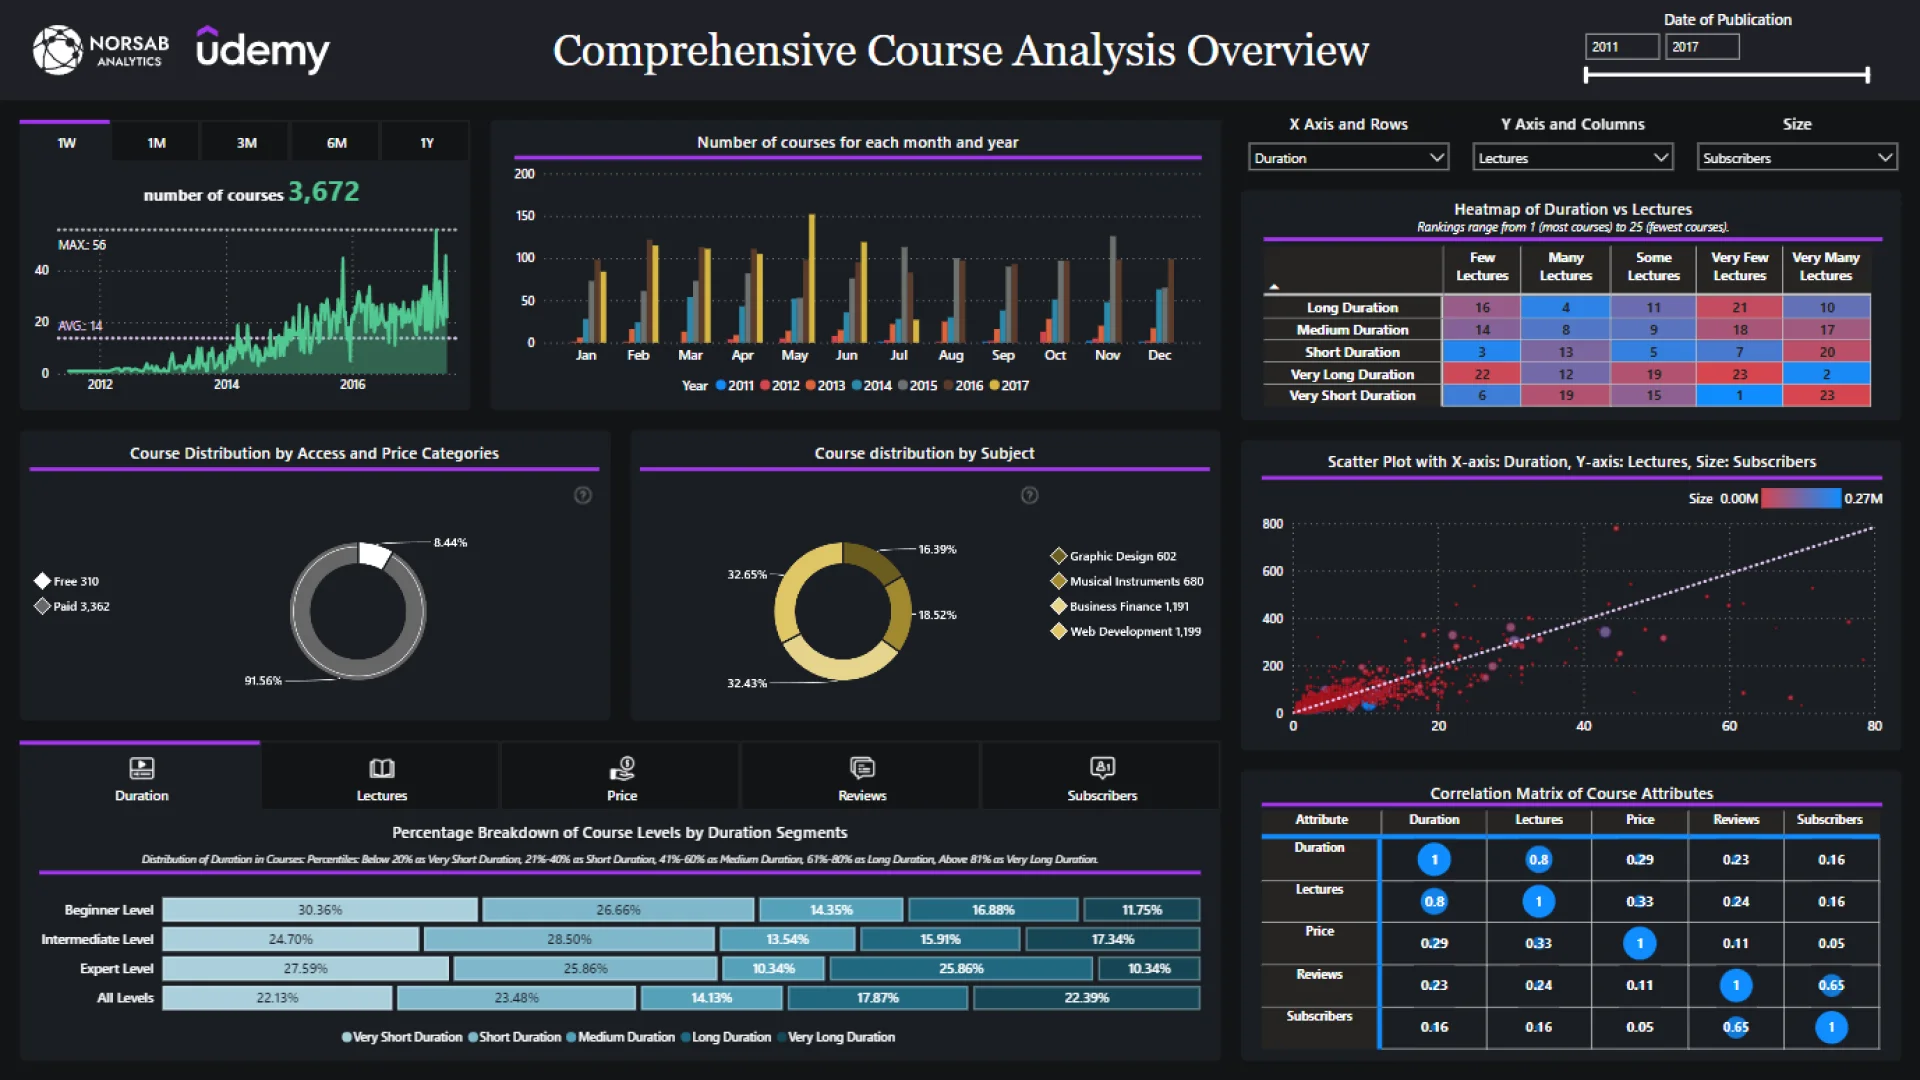
Comprehensive Course Analysis Overview
Comprehensive Course Analysis Overview
Report Author: Norman Reynaldo Sabillon Castro
1290
Share template with others
Report submitted for Onyx Data DataDNA ZoomCharts Mini Challenge, January 2024. The report was built based on Udemy Courses dataset and includes ZoomCharts custom Drill Down PRO visuals for Power BI.
Author's description:
I've put together a dashboard called "Comprehensive Course Analytics Dashboard" that's all about digging into course details. It lets you play with time trends, see the breakdown of free vs. paid courses, and even get into who the courses are for. With some cool interactive elements like heat maps and scatter plots, it's a neat way to get insights into everything from pricing to audience. It's like having a bird's-eye view of the course landscape, and I hope it helps make some great decisions!
ZoomCharts visuals used

4U Report Challenges
Participate in data challenges, build and submit reports to get free template downloads.
Join CommunityMobile view allows you to interact with the report. To Download the template please switch to desktop view.
How to use a PBIX template
Preview the interactive report, download the PBIX file, open it in Power BI Desktop, and replace the same data connection with your own dataset.
Preview and download
Explore the report online and download the PBIX template file.
Open in Power BI Desktop
Open the downloaded PBIX file in Power BI Desktop.
Connect your data
Replace the sample data source with your own dataset.
Refresh and adjust
Refresh the model and update fields or visual were needed.
Save and share
Save your report and publish it for your audience.


