898
Coffee Roaster Review
Coffee Roaster Review
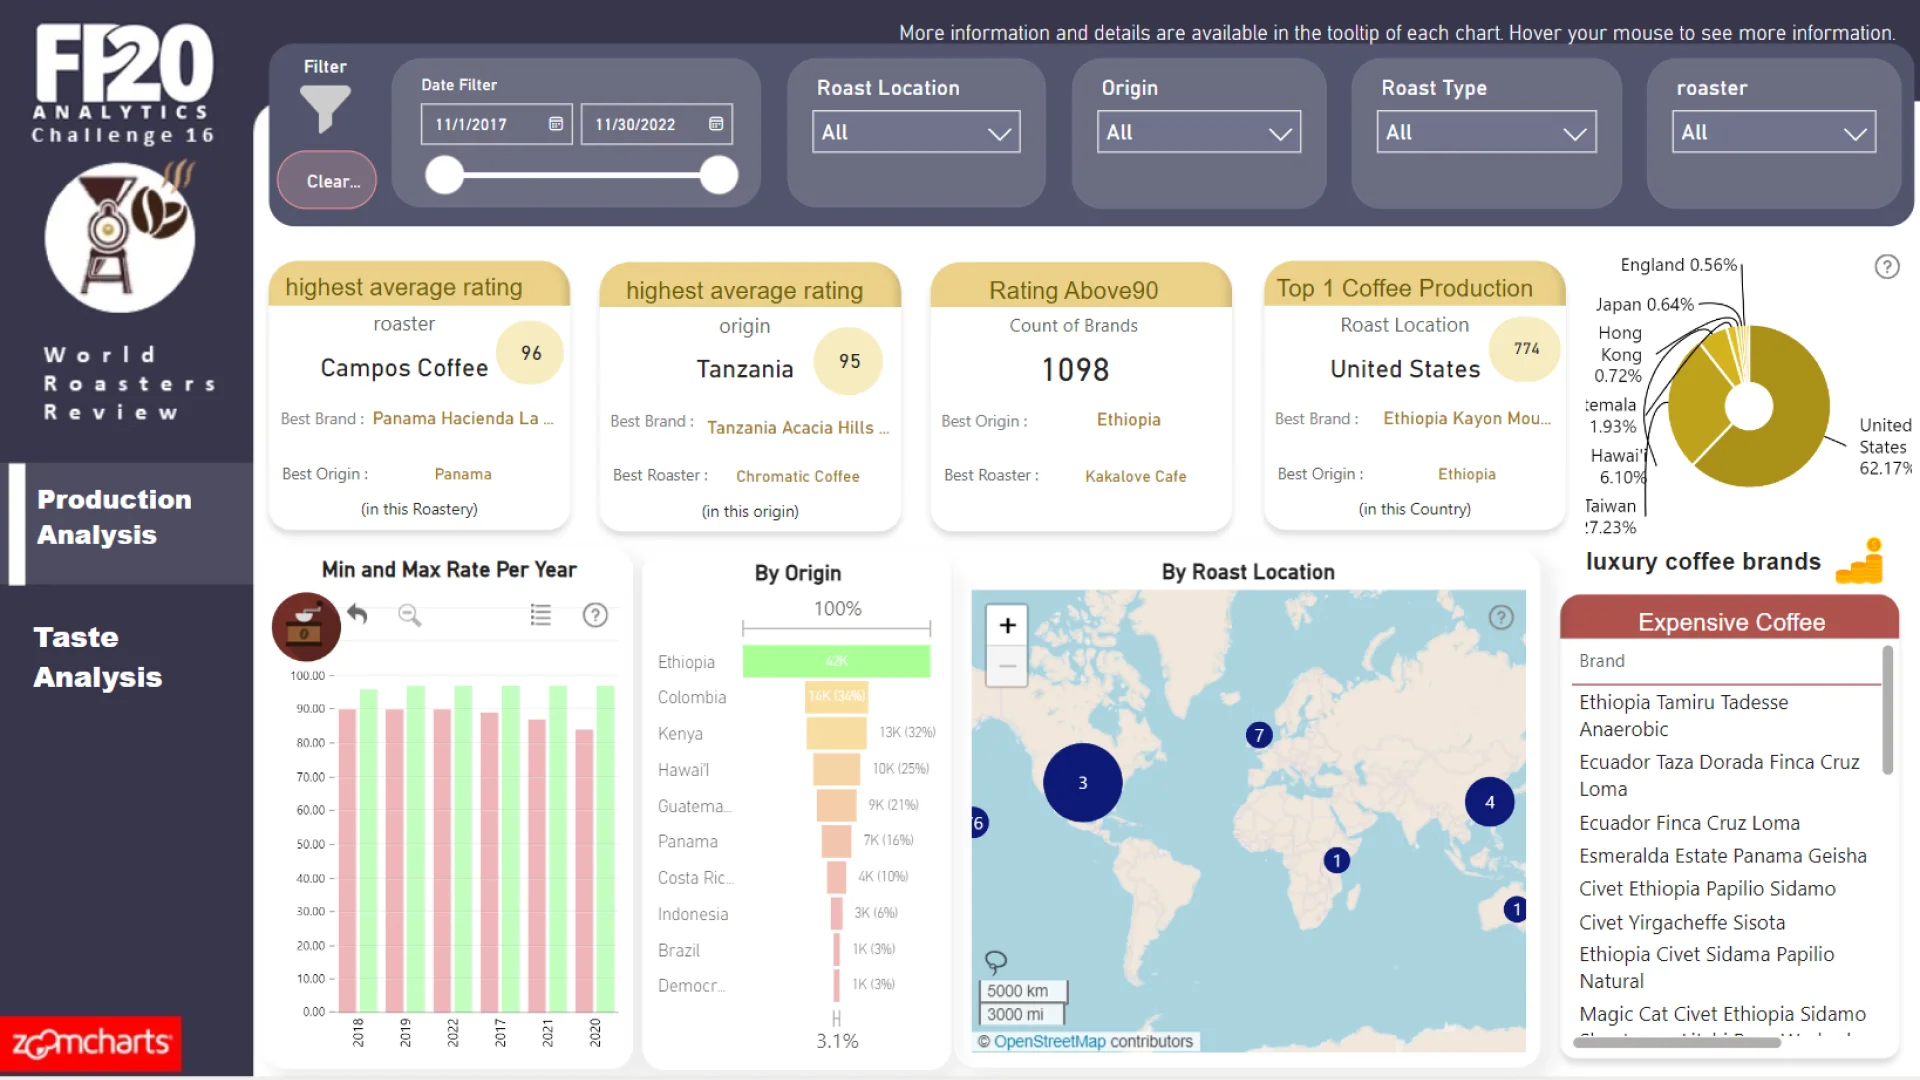
Report Author: Mahsima Zarandi
898
Share template with others
Report submitted for FP20 Analytics ZoomCharts Challenge 16 (May 2024). The report was built with the Coffee Roaster Dataset and includes ZoomCharts custom Drill Down PRO visuals for Power BI.
Author's description:
I am very pleased to have participated in the FP20 Data Analyst Challenge 16. The dataset for this challenge was about global roaster information and was provided in Excel format. Initially, I imported the data into SQL Server and built my desired data model to obtain the necessary results and perform detailed analyses. Based on the challenge document, the specified questions, and highlighted points, I identified the indicators and items for examination, designed the dashboard layout, and implemented it in Power BI. It was an interesting experience, and I enjoyed working on this project. Thank you to ZoomCharts for organizing this excellent challenge.


4U Report Challenges
Participate in data challenges, build and submit reports to get free template downloads.
Join CommunityMobile view allows you to interact with the report. To Download the template please switch to desktop view.
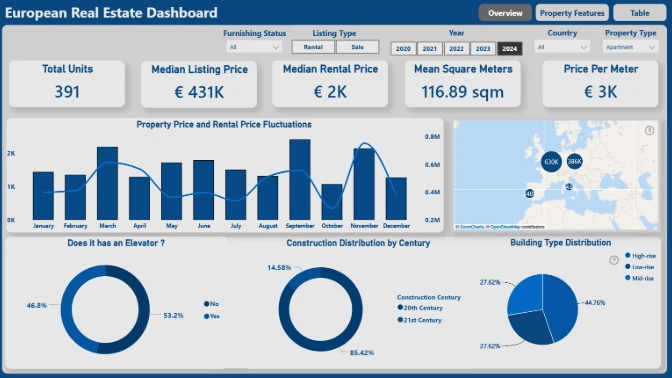
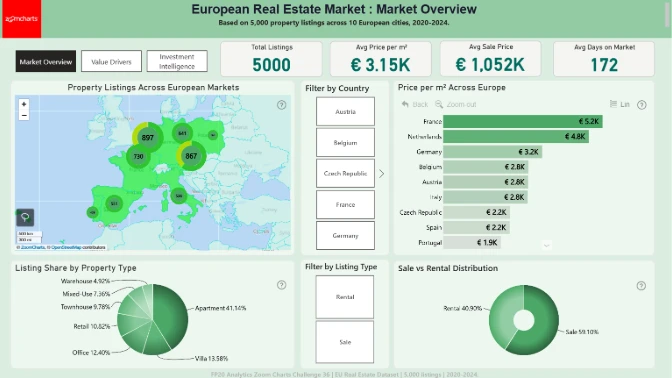
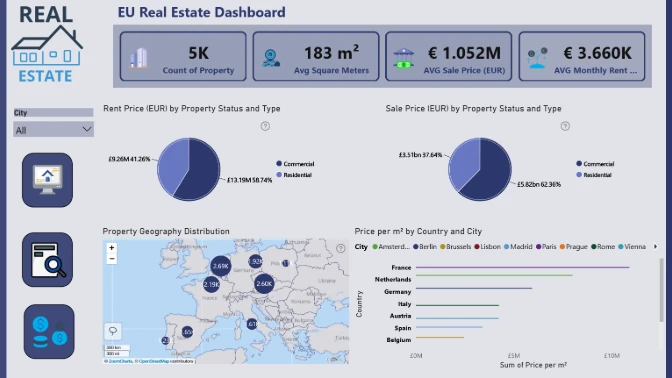
How to use a PBIX template
Preview the interactive report, download the PBIX file, open it in Power BI Desktop, and replace the same data connection with your own dataset.
Preview and download
Explore the report online and download the PBIX template file.
Open in Power BI Desktop
Open the downloaded PBIX file in Power BI Desktop.
Connect your data
Replace the sample data source with your own dataset.
Refresh and adjust
Refresh the model and update fields or visual were needed.
Save and share
Save your report and publish it for your audience.


