1068
Coffee Roaster Dataset Analysis
Coffee Roaster Dataset Analysis
Report Author: Dereck Marin
1068
Share template with others
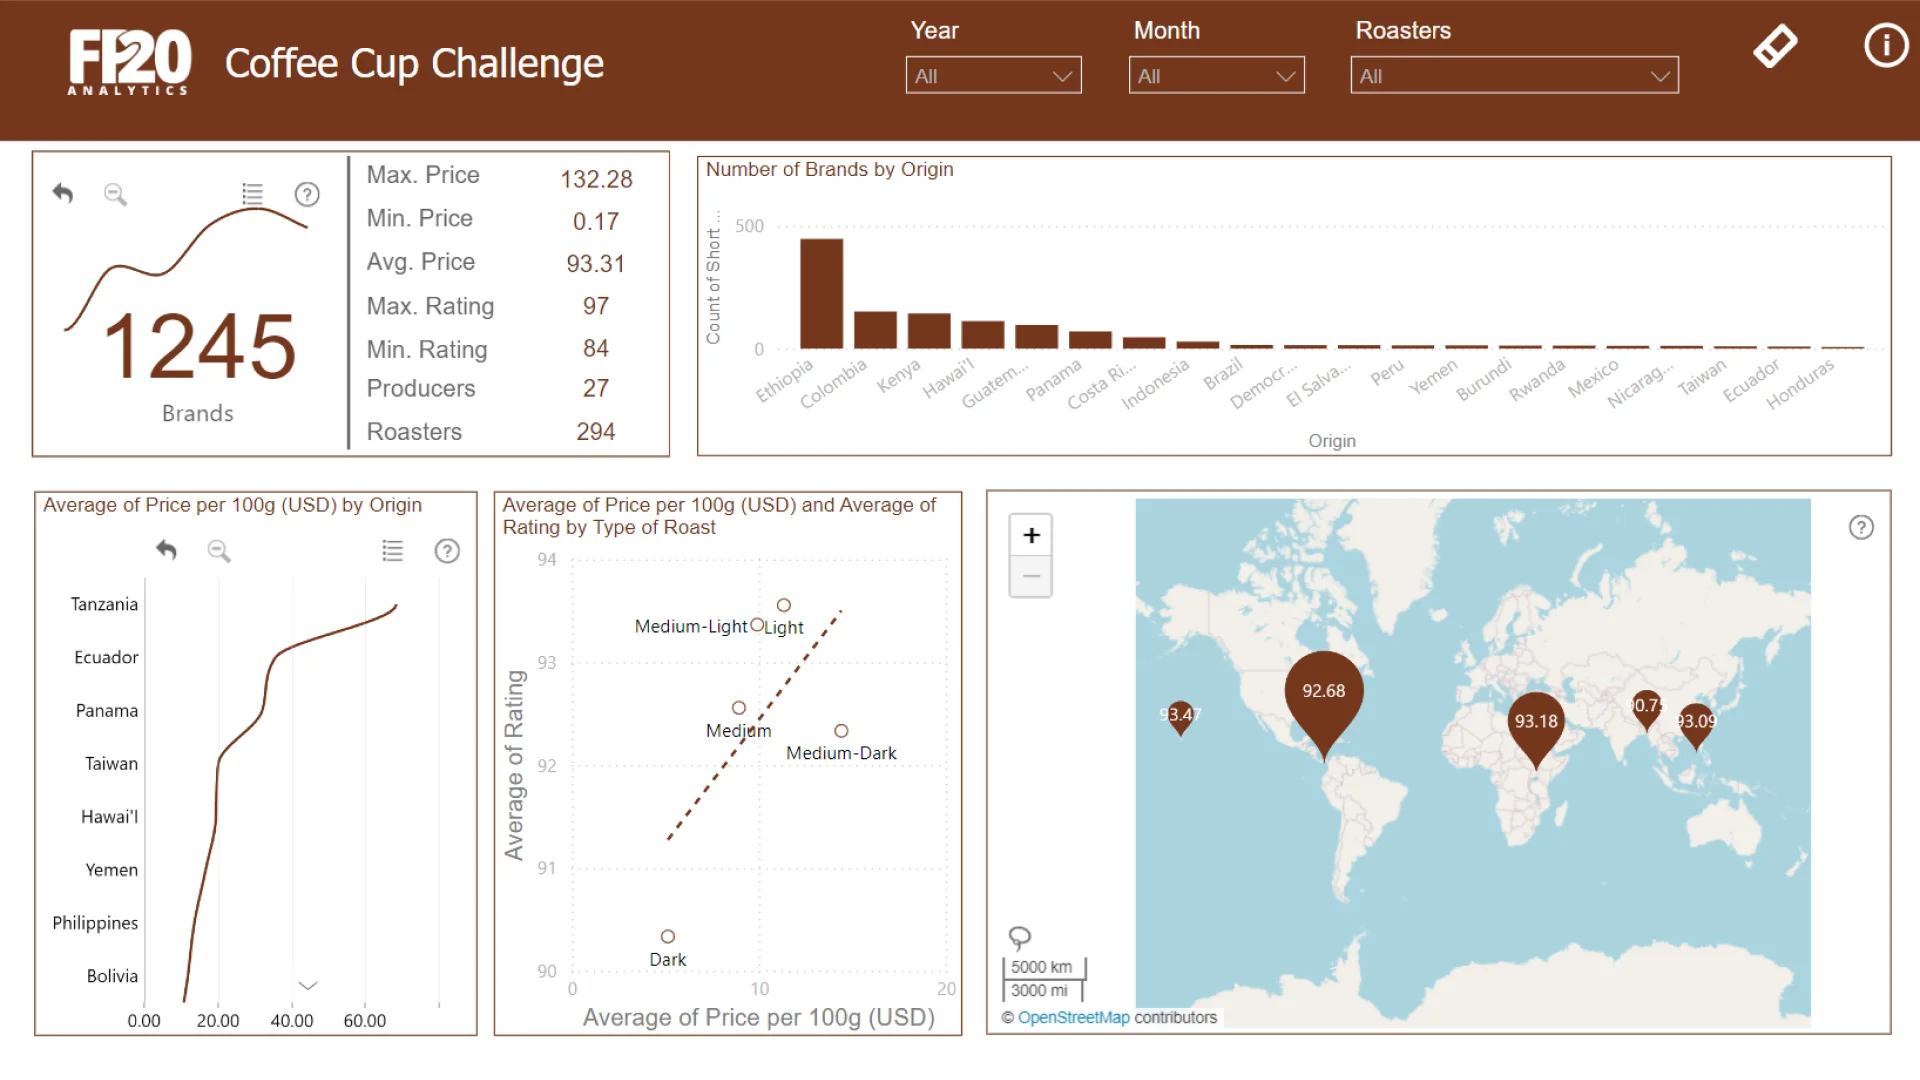
Report submitted for FP20 Analytics ZoomCharts Challenge 16 (May 2024). The report was built with the Coffee Roaster Dataset and includes ZoomCharts custom Drill Down PRO visuals for Power BI.
Author's description:
The Power BI dashboard for the 'Coffee Cup Challenge' by F20 Analytics showcases an analysis of 1,245 coffee brands, highlighting key metrics such as maximum and minimum prices, average price, and ratings. It provides insights into the number of brands by country of origin, average price per 100 grams by origin, and a scatter plot showing the relationship between price and rating by type of roast. Additionally, a map visualization displays average ratings by region globally. The dashboard includes filters for year, month, and roasters, enabling users to dynamically interact with the data and gain specific insights.



4U Report Challenges
Participate in data challenges, build and submit reports to get free template downloads.
Join CommunityMobile view allows you to interact with the report. To Download the template please switch to desktop view.
How to use a PBIX template
Preview the interactive report, download the PBIX file, open it in Power BI Desktop, and replace the same data connection with your own dataset.
Preview and download
Explore the report online and download the PBIX template file.
Open in Power BI Desktop
Open the downloaded PBIX file in Power BI Desktop.
Connect your data
Replace the sample data source with your own dataset.
Refresh and adjust
Refresh the model and update fields or visual were needed.
Save and share
Save your report and publish it for your audience.


