877
Coffee Brands by Origin & Rating
Coffee Brands by Origin & Rating
Report Author: Miikka Karava
877
Share template with others
Report submitted for FP20 Analytics ZoomCharts Challenge 16 (May 2024). The report was built with the Coffee Roaster Dataset and includes ZoomCharts custom Drill Down PRO visuals for Power BI.
Author's description:
Views and Features -
- The report offers 3 distinct views for various metrics.
- A dynamic slicer panel and toggle allow for seamless switching between rating and price views.
Overview Page -
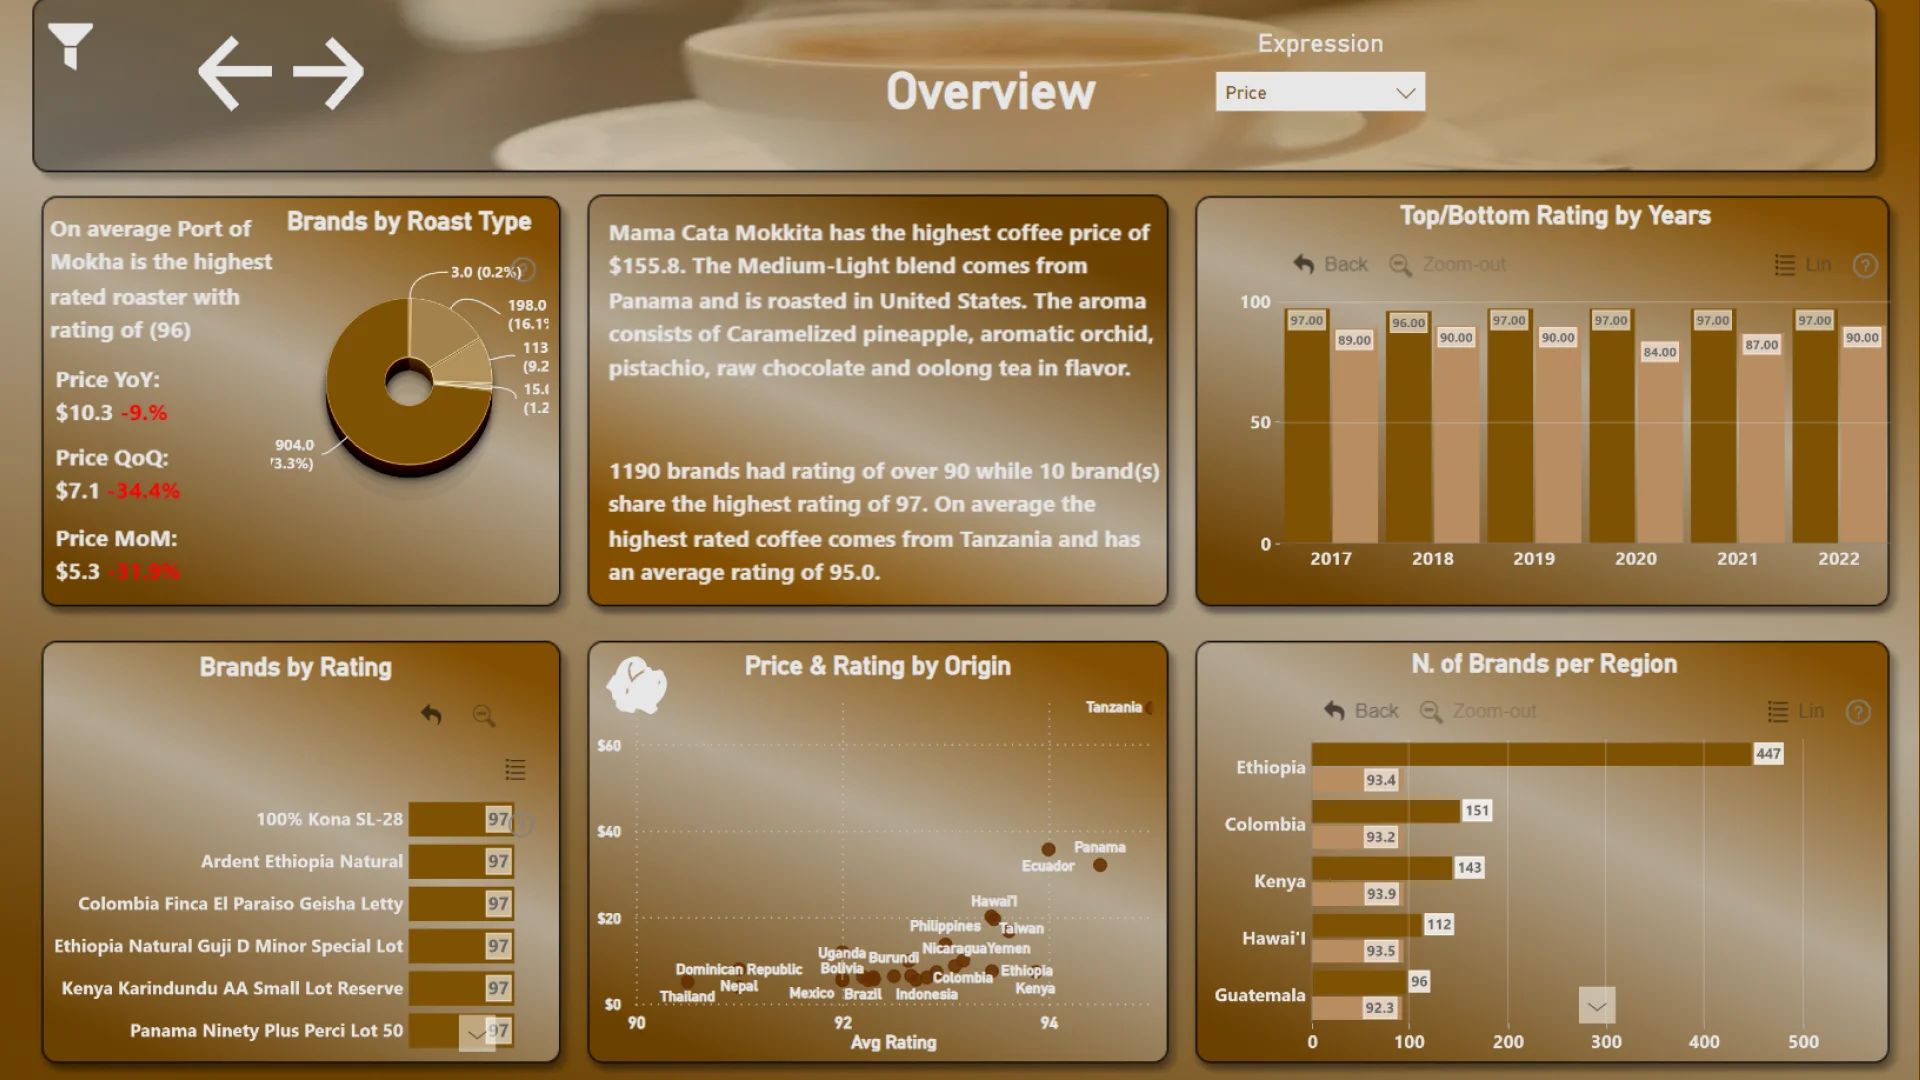
- Top left visual highlights the highest-rated roaster with MoM, QoQ, and YoY views.
- Donut chart on the right displays brands per roast type.
- Key performance indicators (KPIs) showcase highest price and rating:
- On average, Mama Kata Mokkita leads with the highest coffee price of $155.8.
- Medium-Light blend from Panama, roasted in the United States, features aromas of caramelized pineapple, aromatic orchid, pistachio, raw chocolate, and oolong tea.
- 1190 brands received ratings over 90, with 10 brands achieving the highest rating of 97.
- Tanzania produces the highest-rated coffee with an average rating of 95.
- Top and bottom rated brands for each year (2017-2022) displayed in a visual on the top right.
- Bar chart on the bottom left shows brands by rating.
- Scatter chart on the right can switch between Price and Rating averages by Origin, Roast Location, or Roast Type.
- Bottom left visual displays Price, Rating, and number of brands per region.
Brand Insights Page:
-
Top left visual showcases key phrases for Aroma and Flavor/Mouthfeel.
-
Table on the right displays Brands by Price, Rating, and year.
-
Top right line chart displays yearly or monthly intervals for selected expressions, start date, and interval length.
-
Bottom left visuals highlight top-rated brands and recommendations for the Asian market.
-
Top 10 rated brands include Mama Cata Mokkita, 100% Kona SL-28, Rukera Kenya, and others with a rating of 97.
-
Based on top 5 rated Asian brands, recommendations for future coffee blends include round acidity, soft acidity, and singed cheddar flavors.
-
Most frequently appearing mouthfeel key phrases displayed for top 10 brands include Tart, Complex, Sparkling Acidity, and Toffee.
-
Donut visuals in the middle display brands by price and rating groups.
-
Bottom right visual compares current and past year averages for selected expressions.
Origin and Roaster Insights -
- The last page view offers insights into origin and roaster regions and countries.
ZoomCharts visuals used




4U Report Challenges
Participate in data challenges, build and submit reports to get free template downloads.
Join CommunityMobile view allows you to interact with the report. To Download the template please switch to desktop view.
How to use a PBIX template
Preview the interactive report, download the PBIX file, open it in Power BI Desktop, and replace the same data connection with your own dataset.
Preview and download
Explore the report online and download the PBIX template file.
Open in Power BI Desktop
Open the downloaded PBIX file in Power BI Desktop.
Connect your data
Replace the sample data source with your own dataset.
Refresh and adjust
Refresh the model and update fields or visual were needed.
Save and share
Save your report and publish it for your audience.


