10238
Christmas Gift Trends Power BI Retail Sales Dashboard
Christmas Gift Trends Power BI Retail Sales Dashboard
More Report pages
Report Author: Charven Ligan
10238
Share template with others
Summary
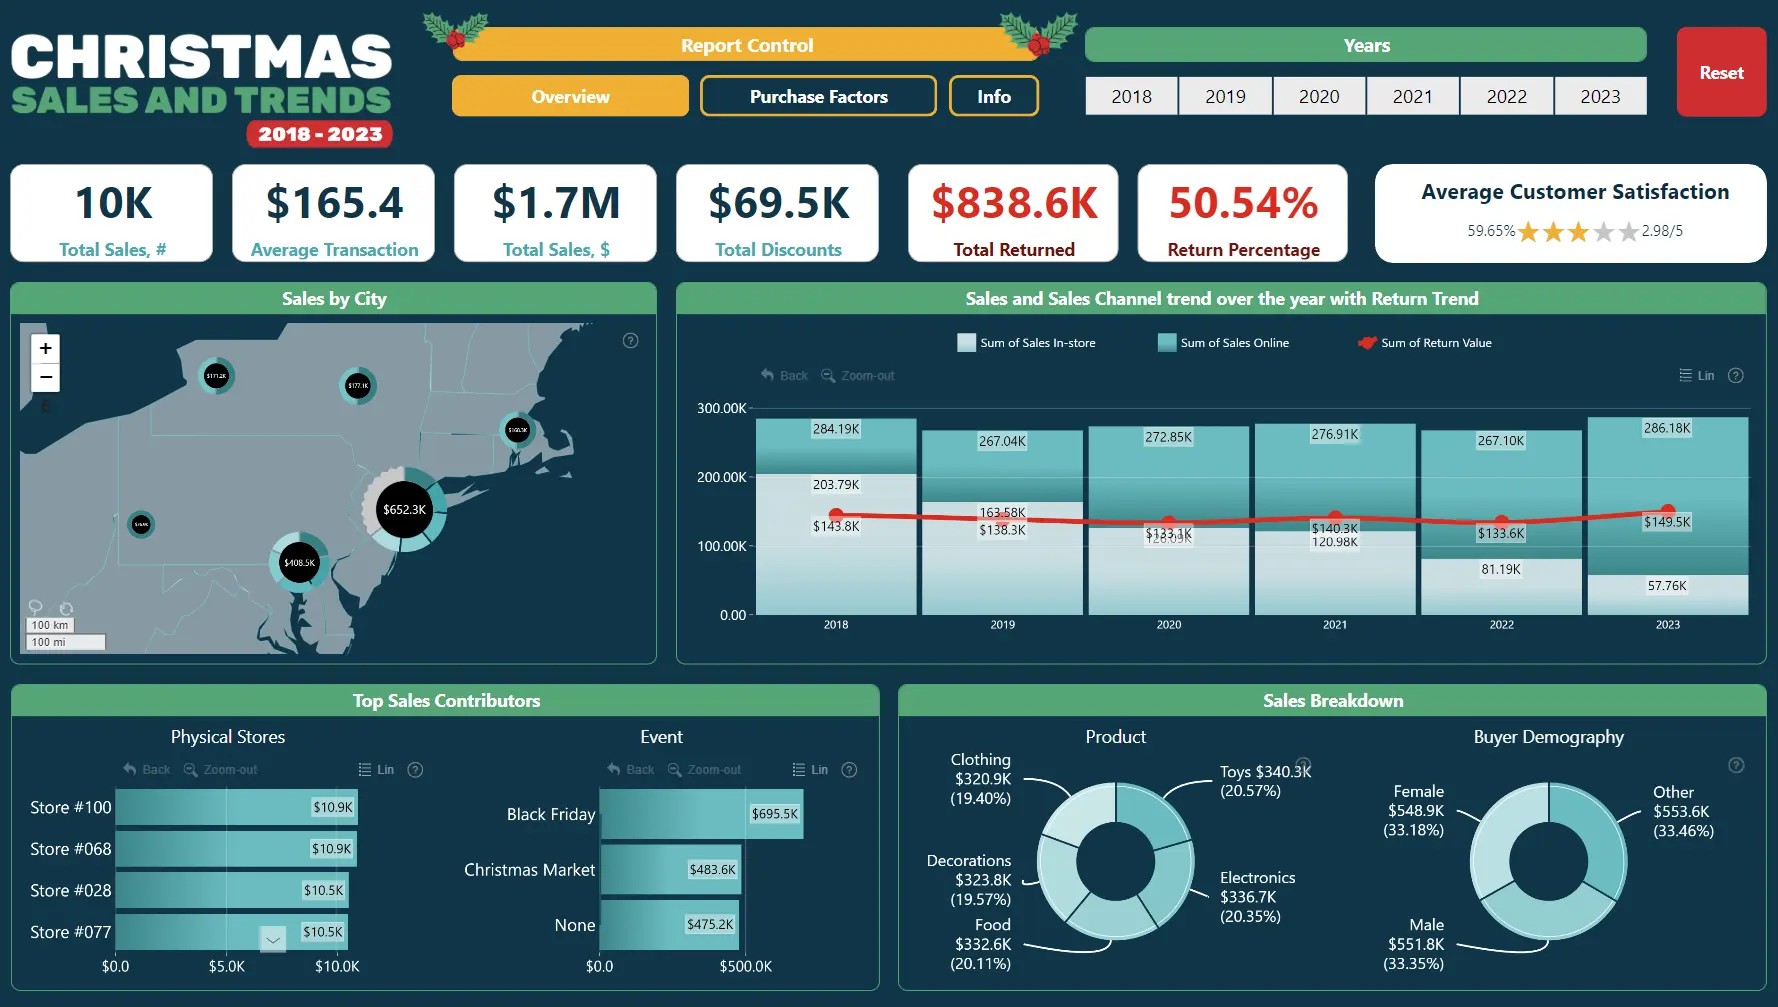
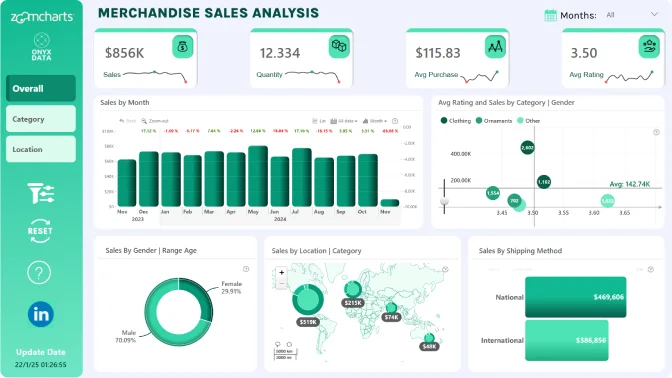
This Christmas Gift Sales & Trends Dashboard Template is the winning entry from the ZoomCharts Mini Challenge held as part of the December 2023 DataDNA Dataset Challenge by Onyx Data. Created by Charven Ligan, the Power BI retail dashboard analyzes Christmas gift sales and helps users explore trends in customer purchasing behavior.
Key Insights of the Christmas Gift Sales & Trends Dashboard
The report is structured across two pages and presents Christmas retail sales from several perspectives. Its key insights include:
- Geographic performance: compare Christmas gift sales across cities
- Product categories: identify sales patterns across different types of gifts
- Buyer demographics: understand how purchasing behavior varies between customer groups
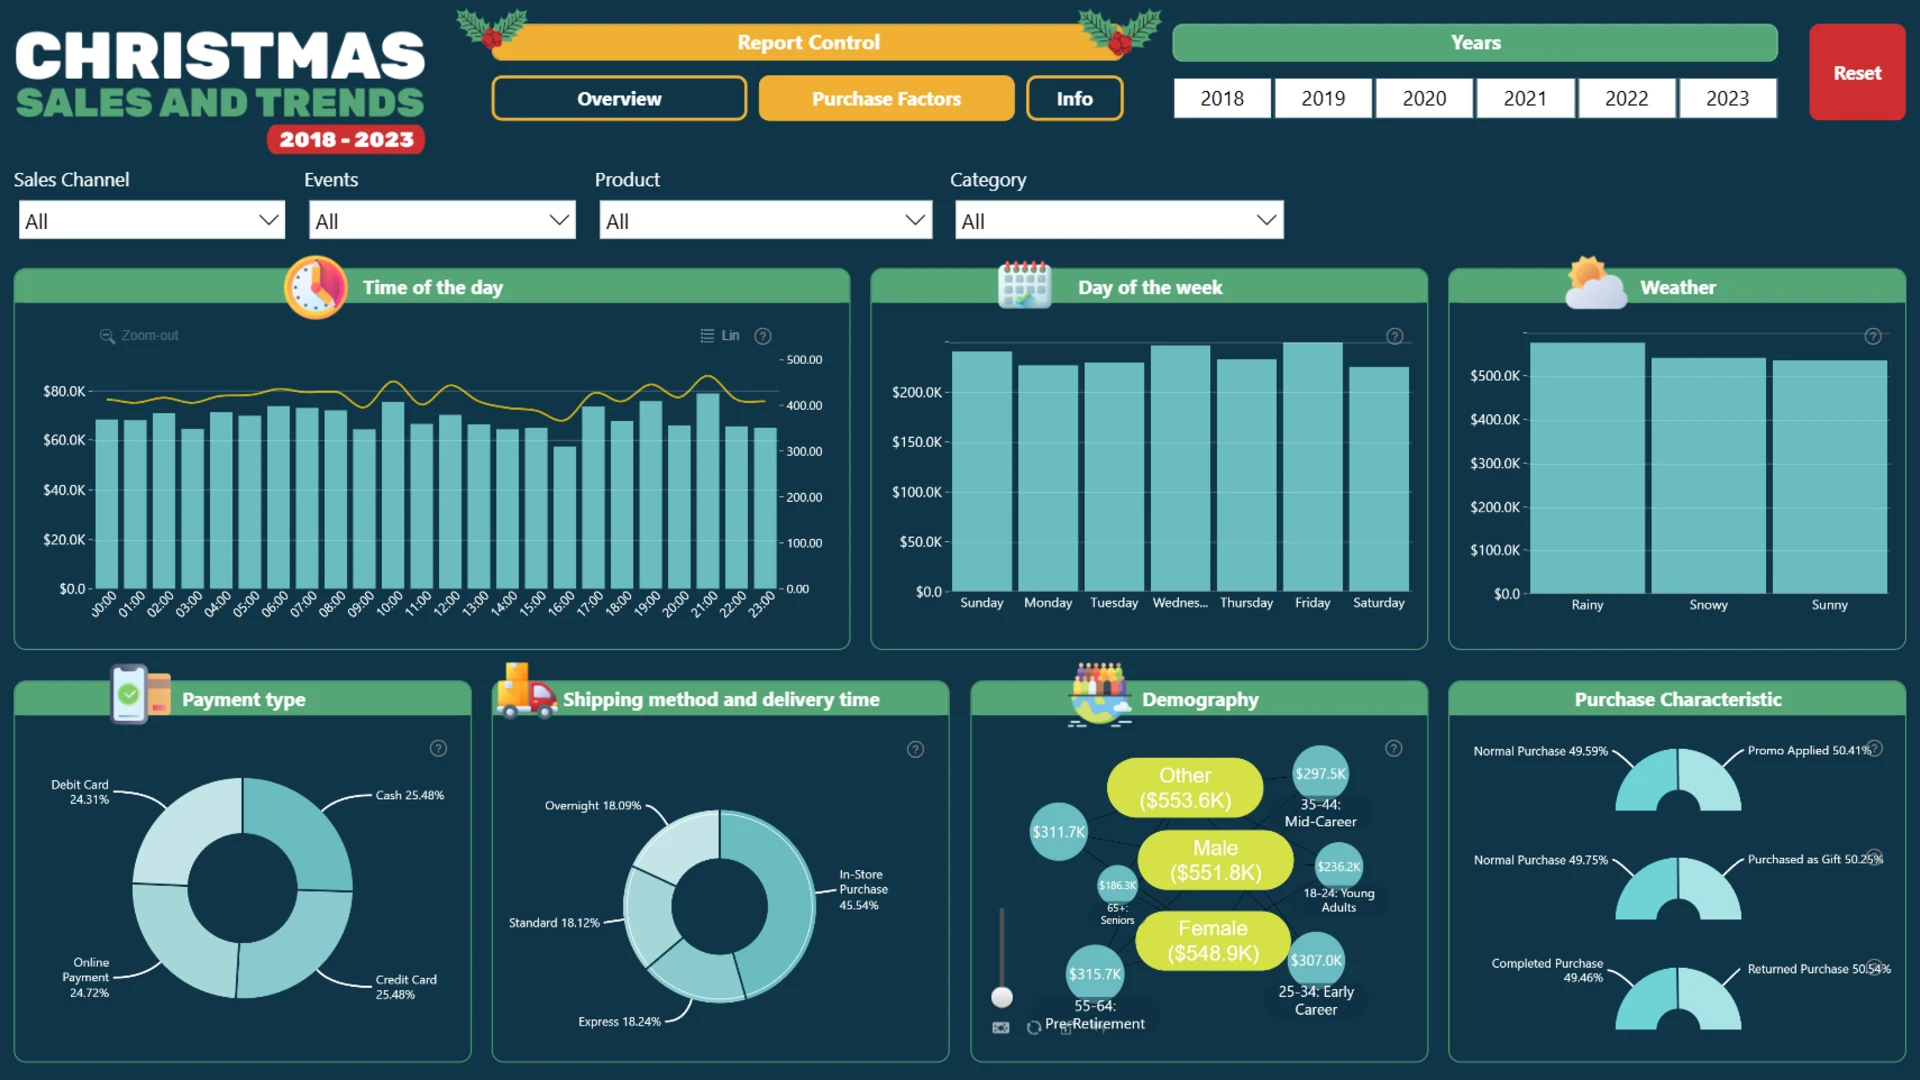
- Purchase timing: examine when customers make their Christmas purchases
- Payment and delivery: compare sales by payment type and shipping method
- Weather conditions: explore how sales results differ across the weather data included in the report
The dashboard uses interactive map, combo, combo bar, network, and donut visuals. These visuals dynamically cross-filter one another, making it quick and easy to analyze the same Christmas sales data from multiple perspectives.
This report is based on Charven Ligan's challenge submission with minor refinements by the ZoomCharts team. See the original Christmas Sales and Trends submission.
How to Use This Christmas Retail Sales Dashboard Template
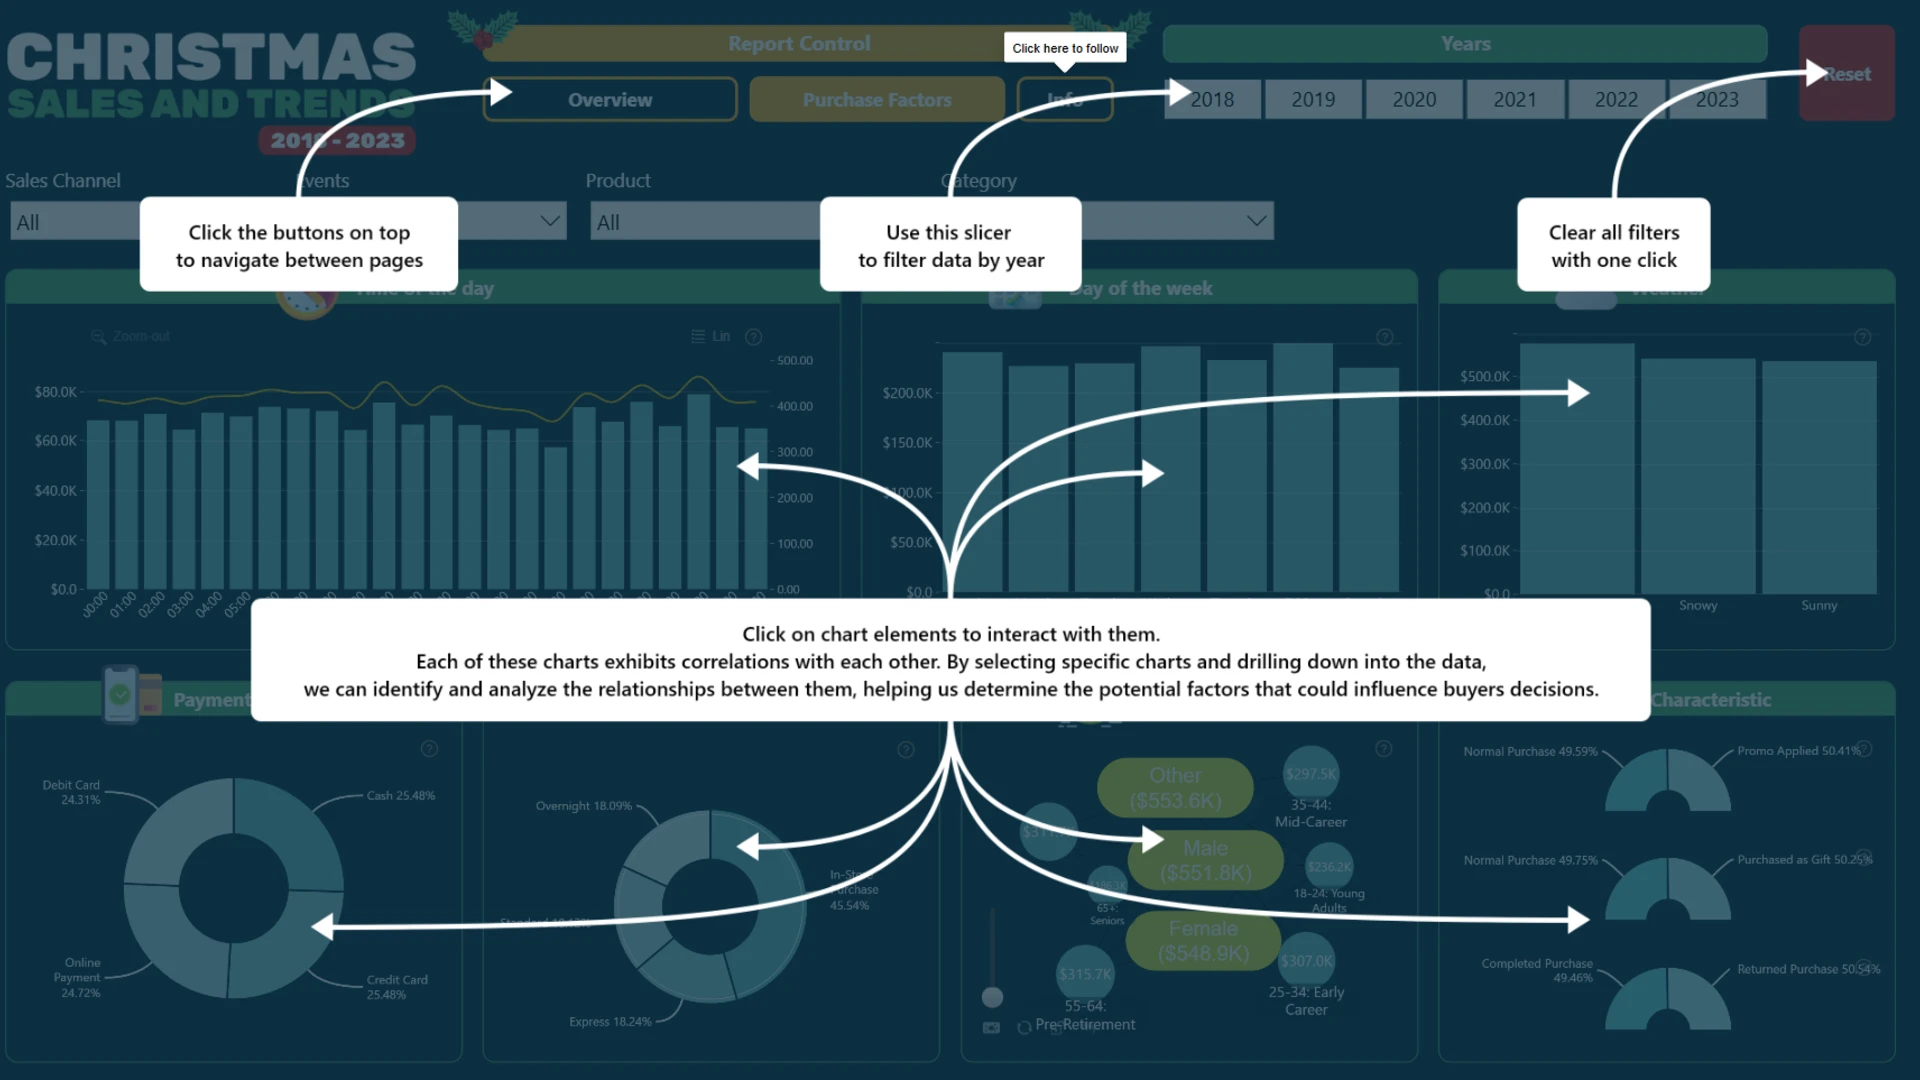
Click any active chart element to filter the report and explore a particular city, product category, buyer group, purchase period, or other data point. Related visuals update automatically to provide additional context.
Download the .pbix file to review the report settings, formulas, calculations, and interactions. Replace the sample data with your own to customize this Power BI retail dashboard template for seasonal or holiday sales reporting.
ZoomCharts visuals used





4U Report Challenges
Participate in data challenges, build and submit reports to get free template downloads.
Join CommunityMobile view allows you to interact with the report. To Download the template please switch to desktop view.
How to use a PBIX template
Preview the interactive report, download the PBIX file, open it in Power BI Desktop, and replace the same data connection with your own dataset.
Preview and download
Explore the report online and download the PBIX template file.
Open in Power BI Desktop
Open the downloaded PBIX file in Power BI Desktop.
Connect your data
Replace the sample data source with your own dataset.
Refresh and adjust
Refresh the model and update fields or visual were needed.
Save and share
Save your report and publish it for your audience.


