19674
Christmas Gift Trends Power BI Retail Sales Dashboard by Charven Ligan
Christmas Gift Trends Power BI Retail Sales Dashboard by Charven Ligan
More Report pages
Report Author: Charven Ligan
19674
Share template with others
Summary
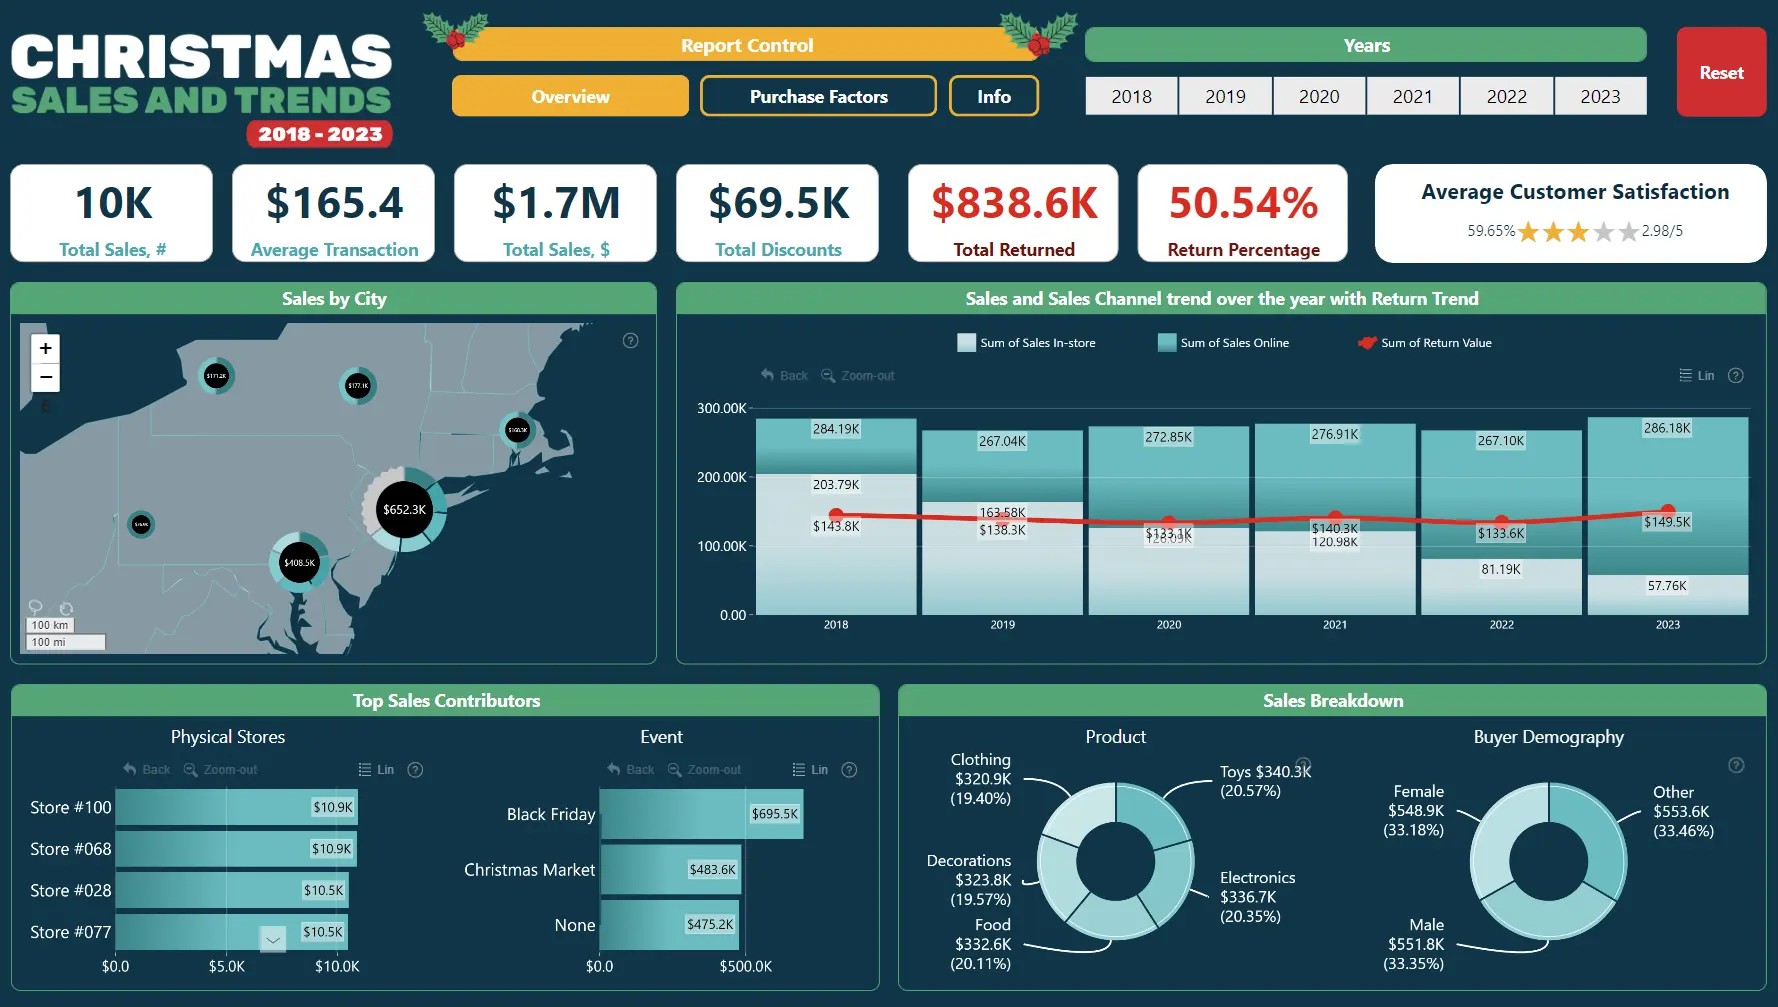
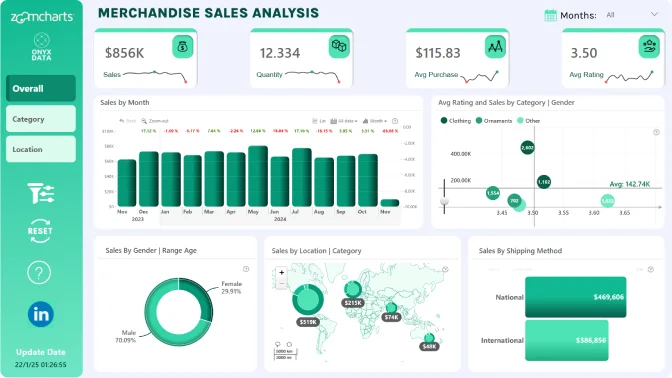
This Power BI retail sales dashboard is the winning entry for the ZoomCharts Mini Challenge which was a part of the December 2023 DataDNA Dataset Challenge, hosted by Onyx Data. The challenge dataset included Christmas gift sales, and the aim was to find trends in customer behavior.
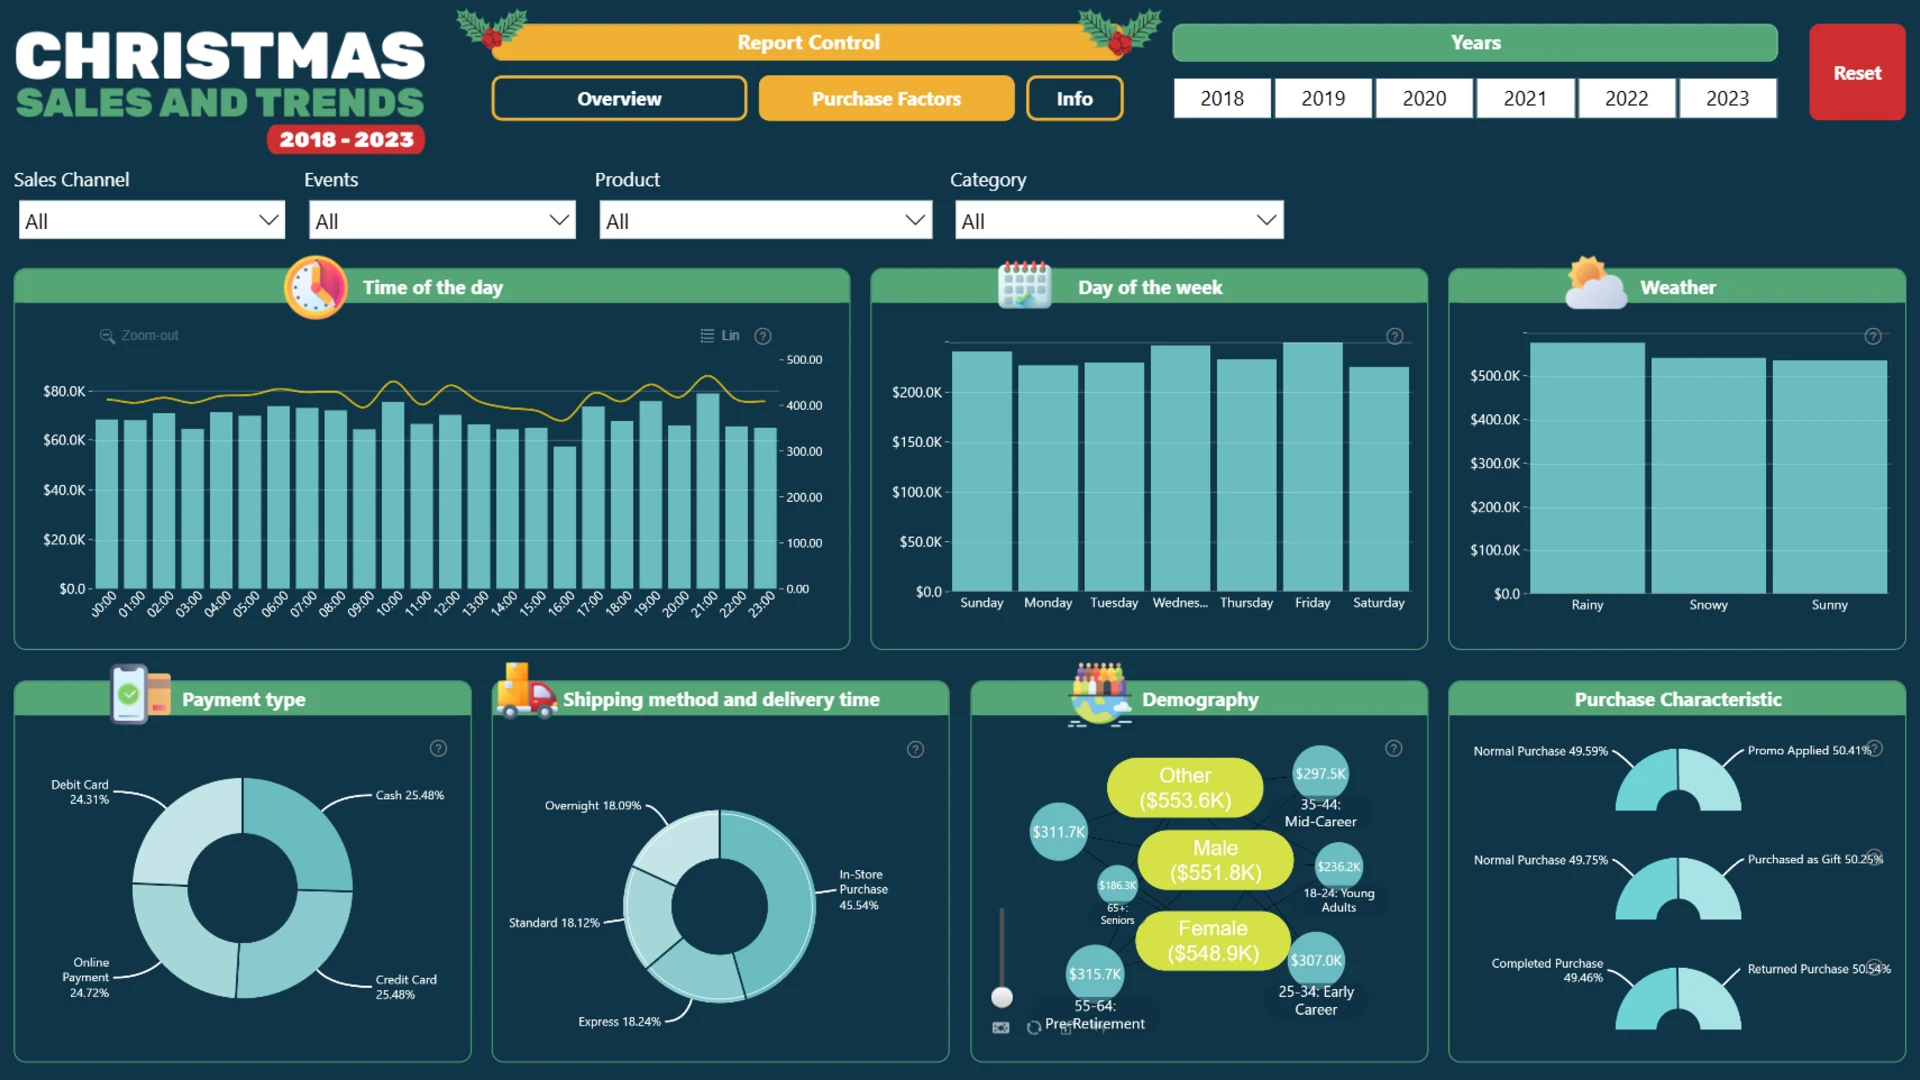
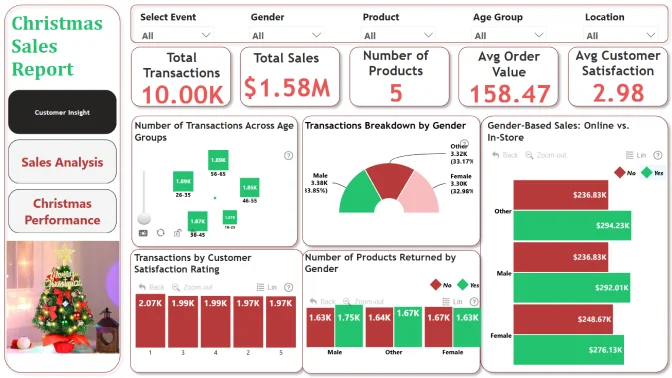
Across multiple visuals that dynamically cross-filter each other, this report allows the user to analyze the same data from multiple dimensions, including sales by city, product category, buyer demographic, and time of purchase. The second page reveals even more detailed insights, such as sales per payment type, shipping method, and even weather conditions.
This Power BI retail sales dashboard is based on the challenge submission with minor refinements by ZoomCharts. See the original submission here.
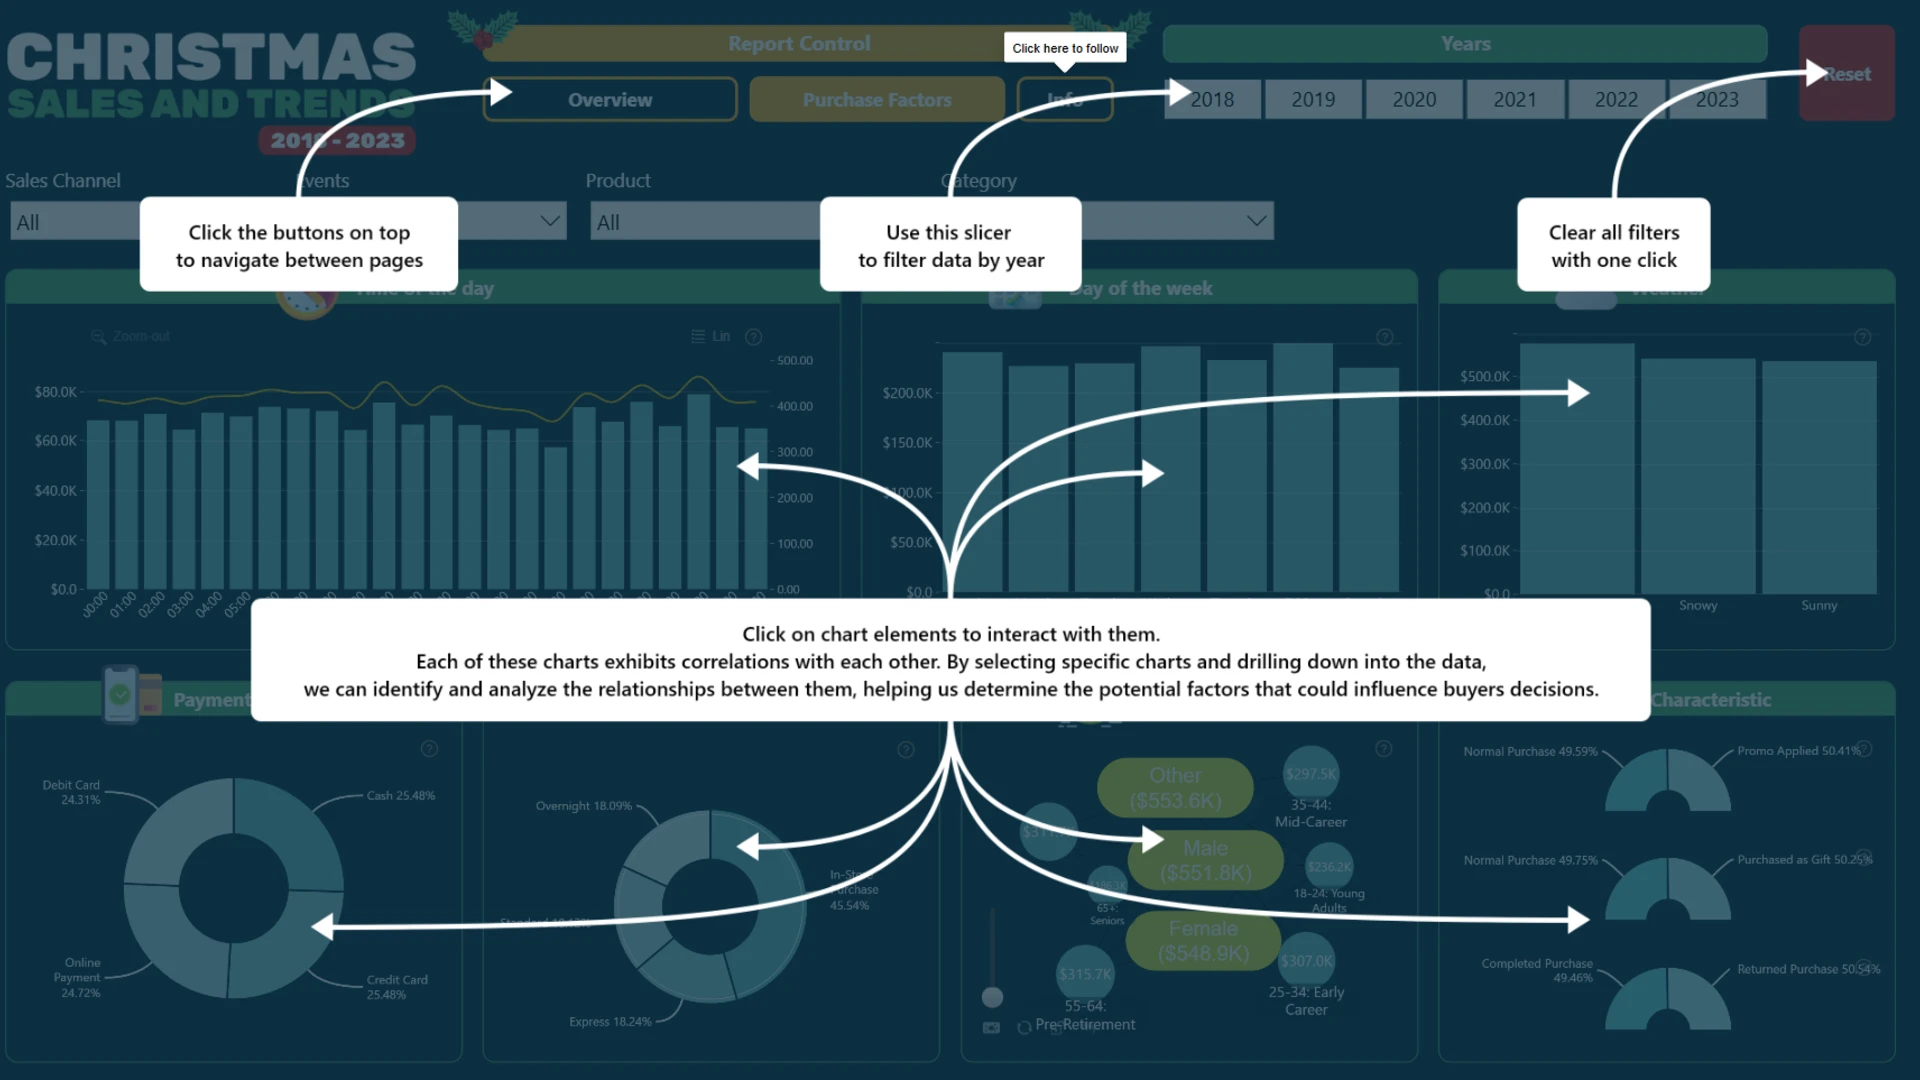
How To Use This Report Template
To interact with this Power BI report, simply click any active elements directly on the charts. Download this report to see all the settings, formulas, and calculations. Try it out with your own data by making a few adjustments.
ZoomCharts visuals used
4U Report Challenges
Participate in data challenges, build and submit reports to get free template downloads.
Join CommunityMobile view allows you to interact with the report. To Download the template please switch to desktop view.
Was this helpful? Thank you for your feedback!
Sorry about that.
How can we improve it?