22895
Christmas Gift Sales & Customer Analytics Power BI Dashboard
Christmas Gift Sales & Customer Analytics Power BI Dashboard
More Report pages
Report Author: Overhauled by ZoomCharts
22895
Share template with others
Summary
This Christmas Gift Sales and Customer Analytics Dashboard helps retailers analyze seasonal sales, customer behavior, product demand, and profit margins in Power BI. It is the winning entry from the FP20 Analytics December 2023 ZoomCharts Challenge.
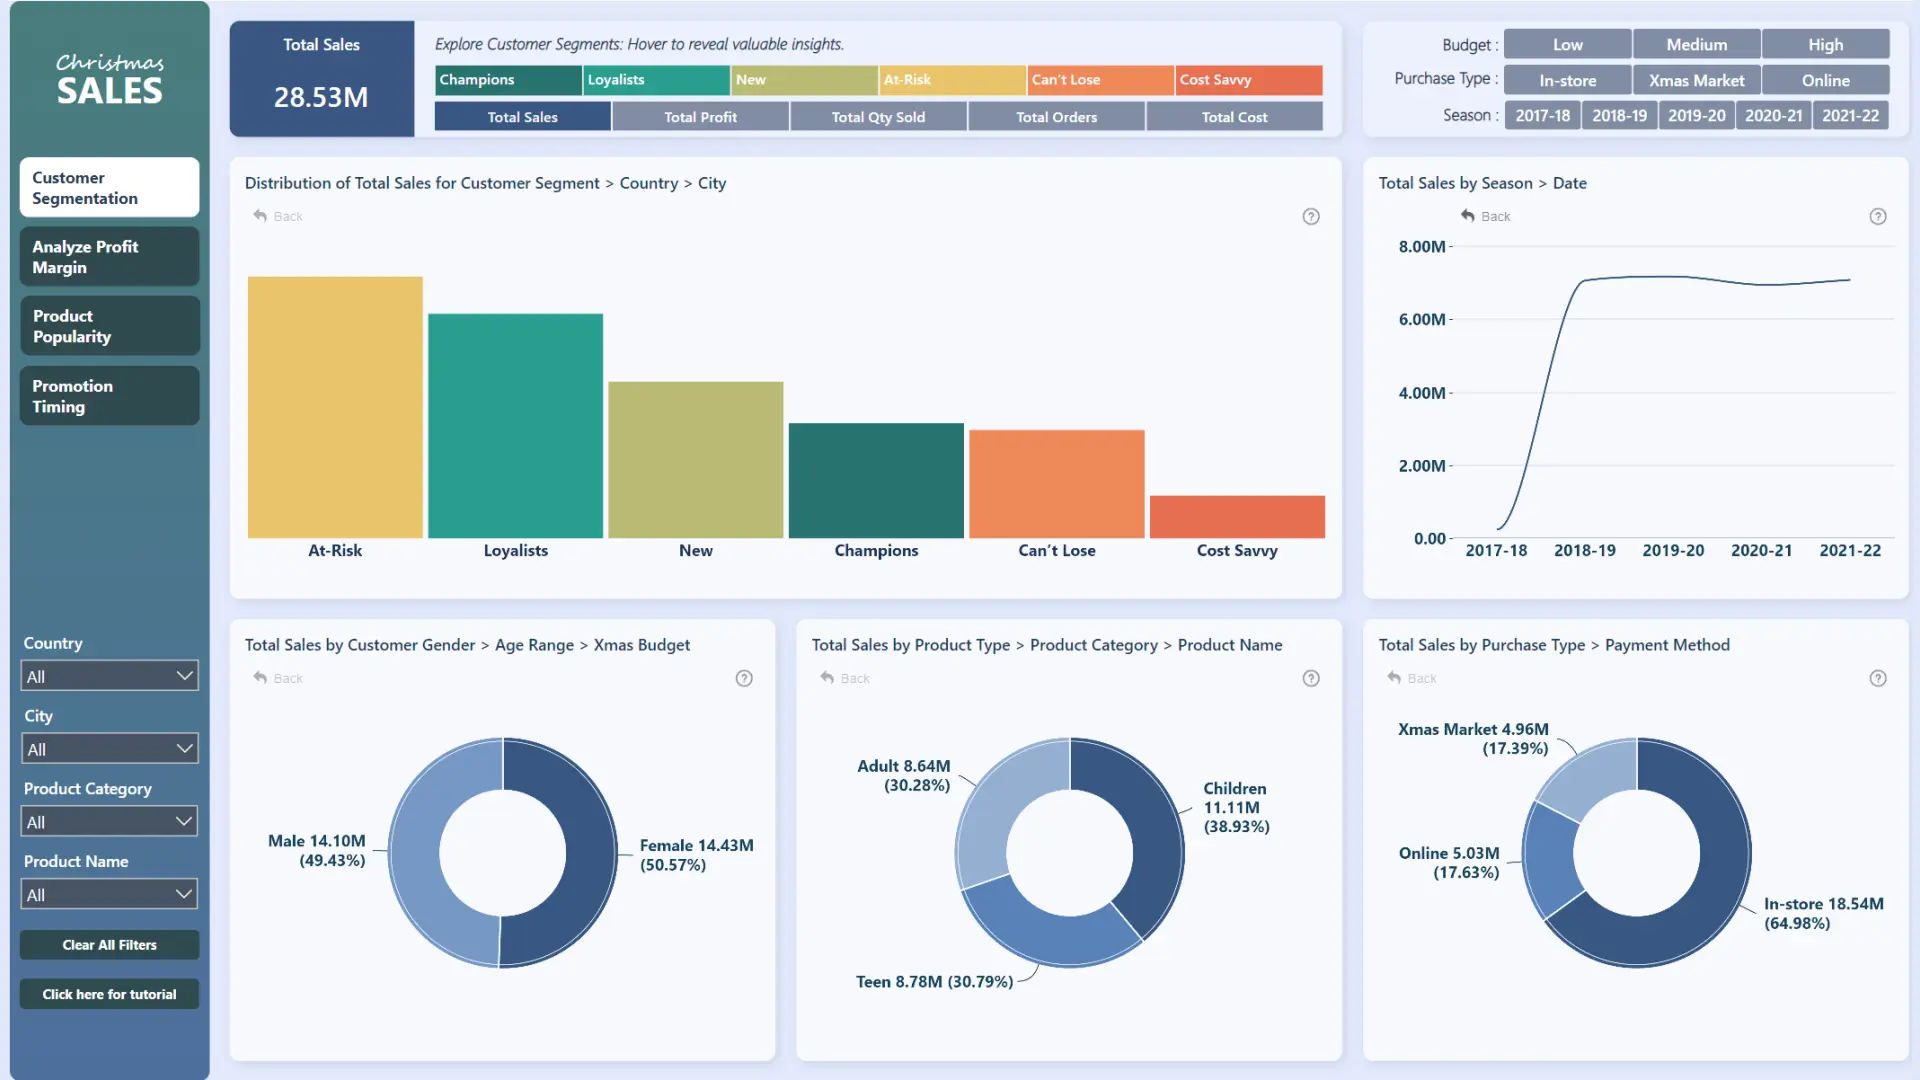
The report combines retail sales analysis with customer segmentation to help users identify buying patterns, compare customer groups, and find opportunities for more focused promotions and pricing decisions.
Key Insights of the Christmas Gift Sales and Customer Analytics Dashboard
The report uses dedicated pages, slicers, and cross-filtering visuals to examine Christmas gift sales from several perspectives. Key insights include:
- Sales performance: Track seasonal sales patterns and compare results across products and customer groups.
- Customer segmentation: Analyze customer groups created through RFM analysis and K-means clustering.
- Customer behavior: Examine how purchasing patterns vary across segments and demographic groups.
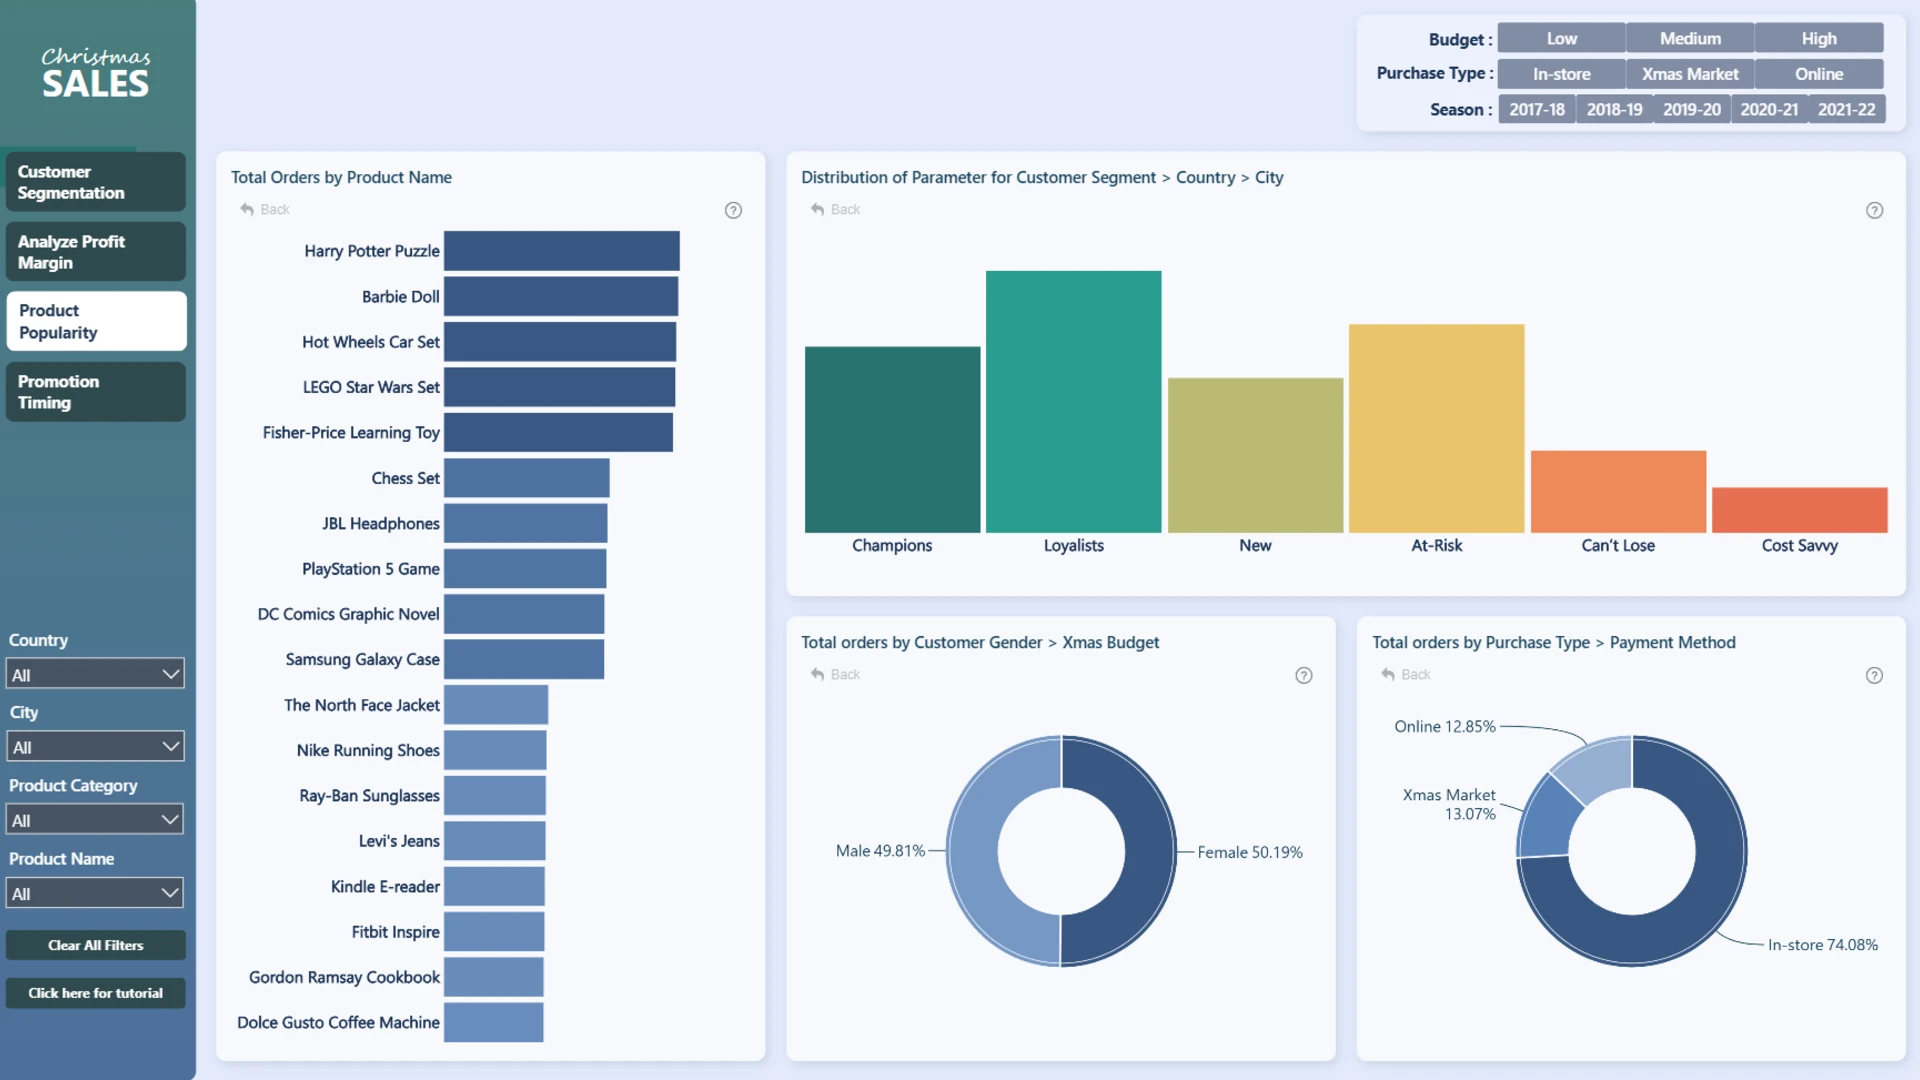
- Product performance: Identify popular Christmas gifts and compare demand across different customer profiles.
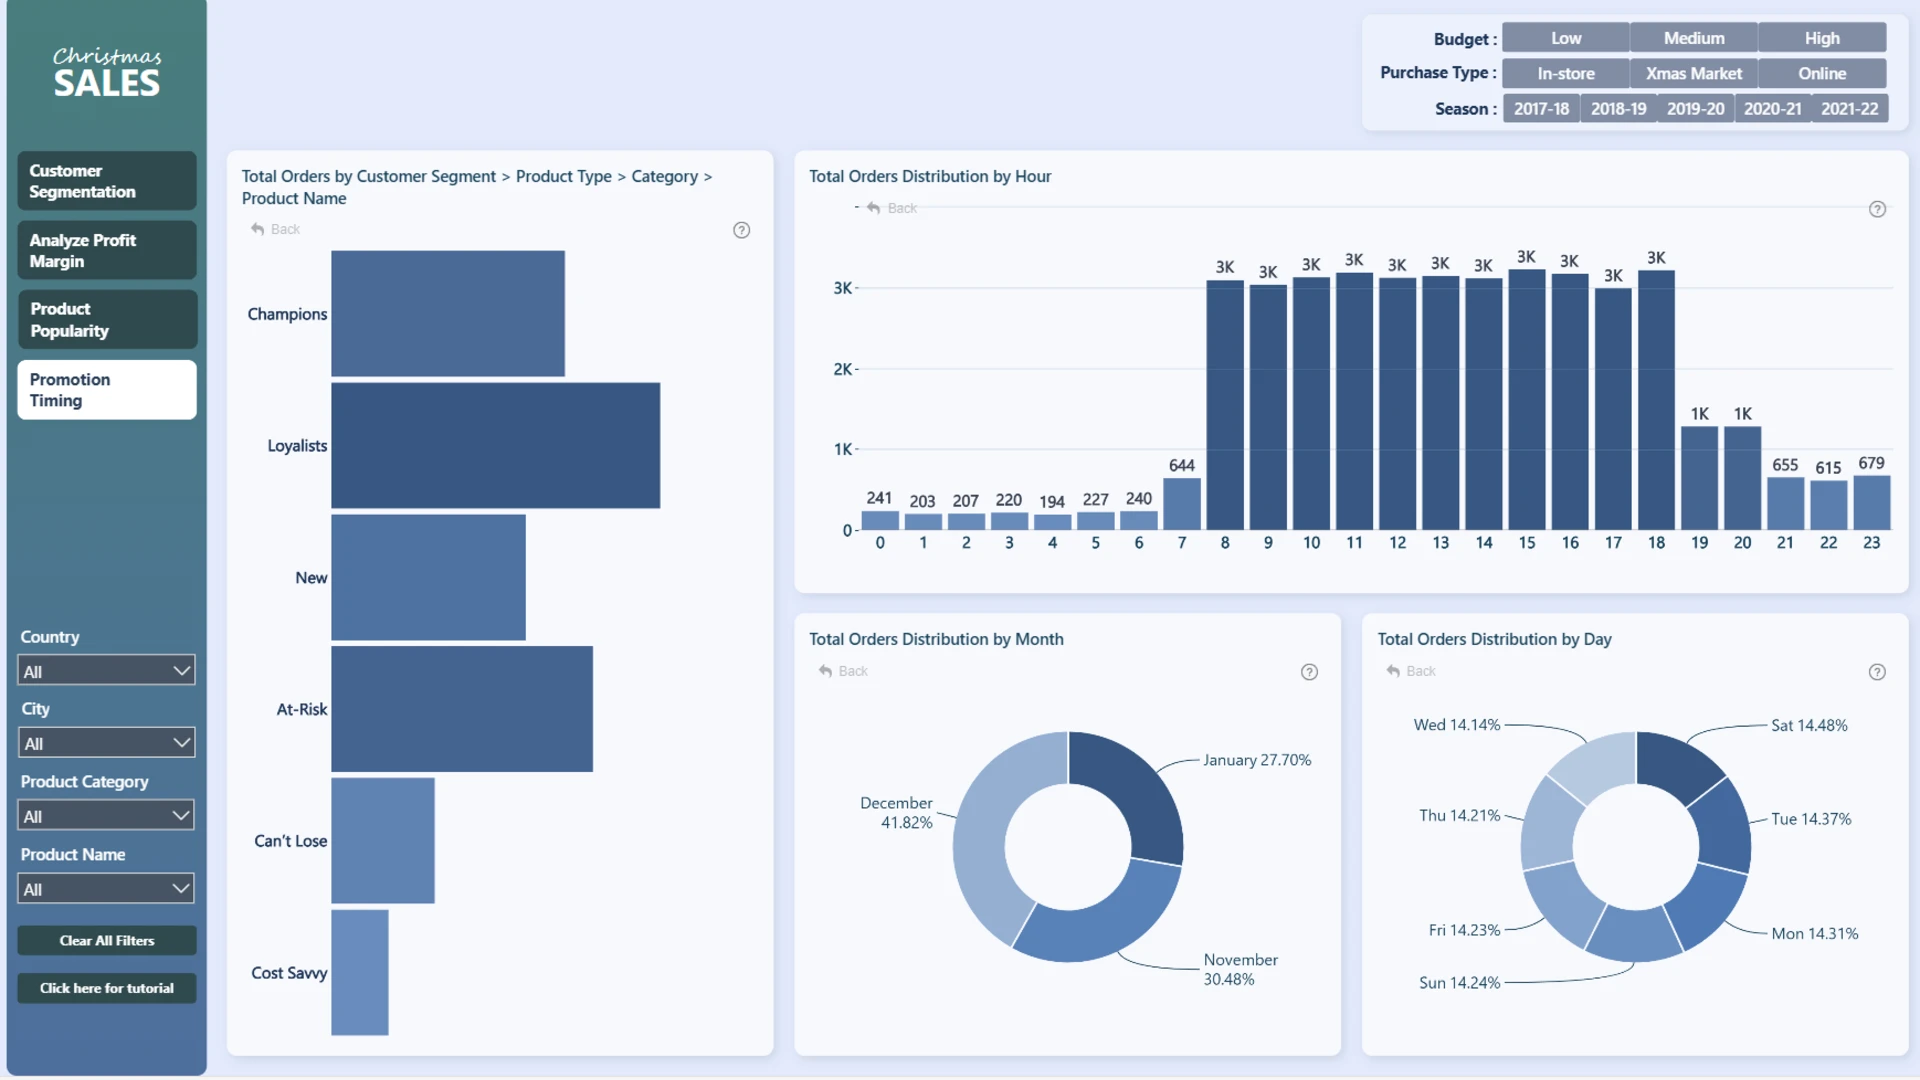
- Promotion timing: Explore when products could be promoted or introduced based on sales patterns.
- Profit margins: Use scatter plot analysis to compare product performance and identify possible pricing adjustments.
Interactive visuals cross-filter the report dynamically, while descriptive chart titles show the available drill-down levels. This makes it easy to move from an overall sales view to detailed customer, product, and profitability analysis.
This report was created by Prathamesh Sawant and refined by the ZoomCharts team. View the original challenge submission.
How to Use This Christmas Gift Sales and Customer Analytics Dashboard
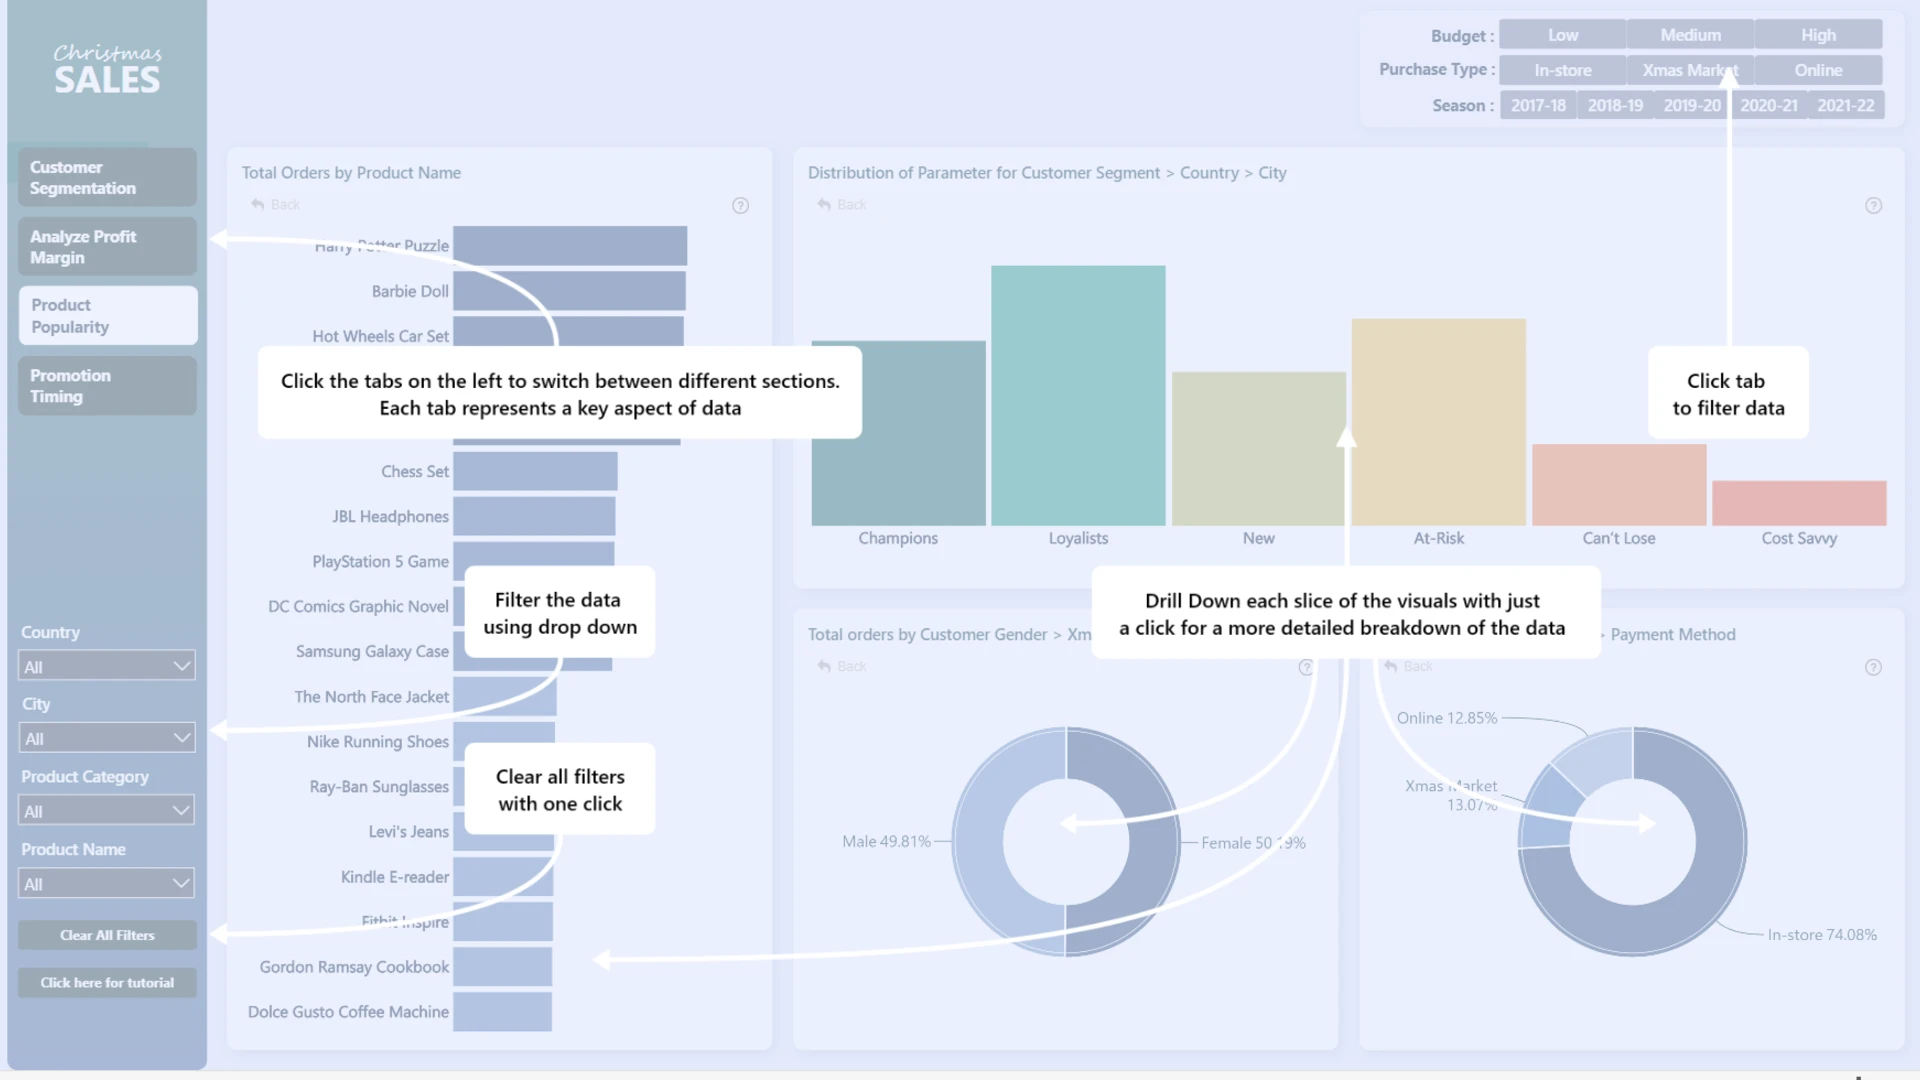
Use the report navigation and slicers to explore individual topics. Click active chart elements to filter other visuals, compare customer segments, or drill down into specific product and sales categories.
Download the .pbix template to review the report settings, customer segmentation approach, formulas, and calculations. Adapt the template to analyze your own holiday, gift, or seasonal retail sales data.
ZoomCharts visuals used




4U Report Challenges
Participate in data challenges, build and submit reports to get free template downloads.
Join CommunityMobile view allows you to interact with the report. To Download the template please switch to desktop view.
How to use a PBIX template
Preview the interactive report, download the PBIX file, open it in Power BI Desktop, and replace the same data connection with your own dataset.
Preview and download
Explore the report online and download the PBIX template file.
Open in Power BI Desktop
Open the downloaded PBIX file in Power BI Desktop.
Connect your data
Replace the sample data source with your own dataset.
Refresh and adjust
Refresh the model and update fields or visual were needed.
Save and share
Save your report and publish it for your audience.


