21694
Christmas Gift Power BI Sales Dashboard by Prathamesh Sawant
Christmas Gift Power BI Sales Dashboard by Prathamesh Sawant
More Report pages
Report Author: Prathamesh Sawant
21694
Share template with others
Summary
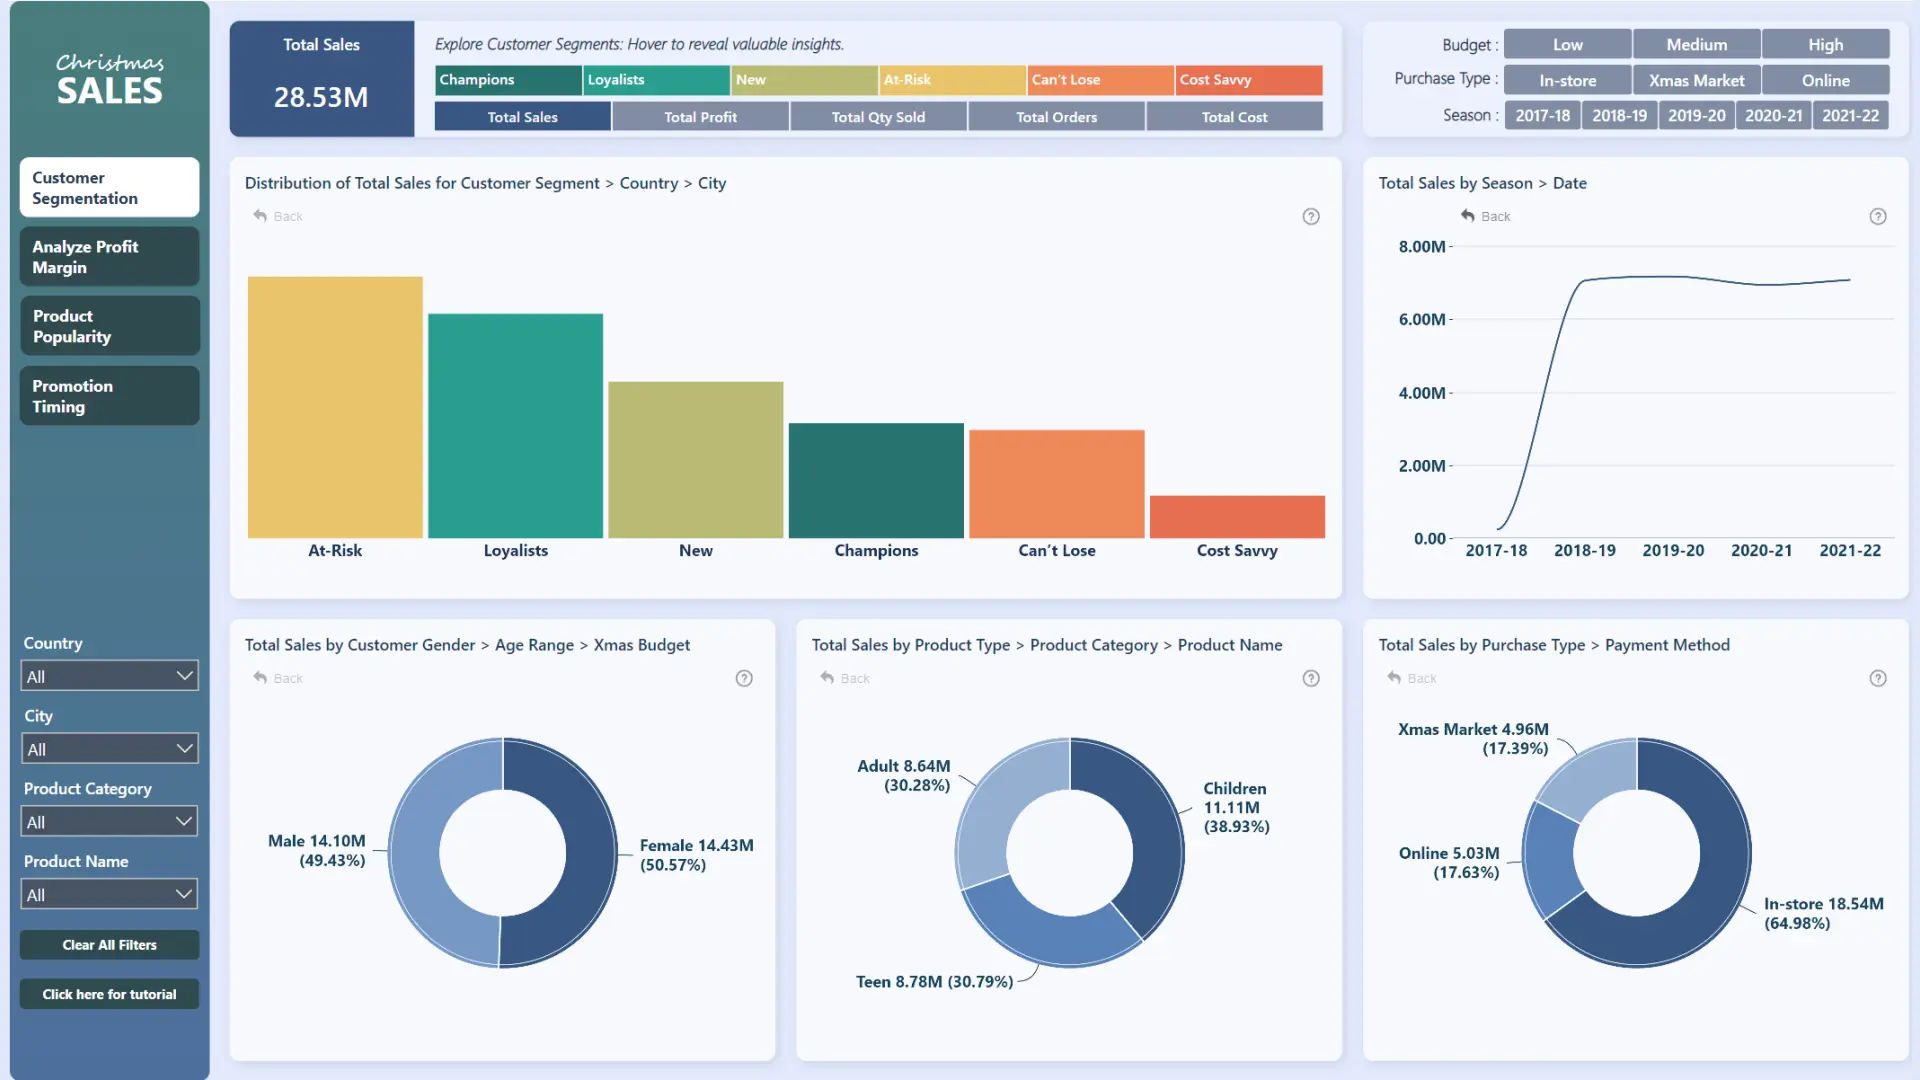
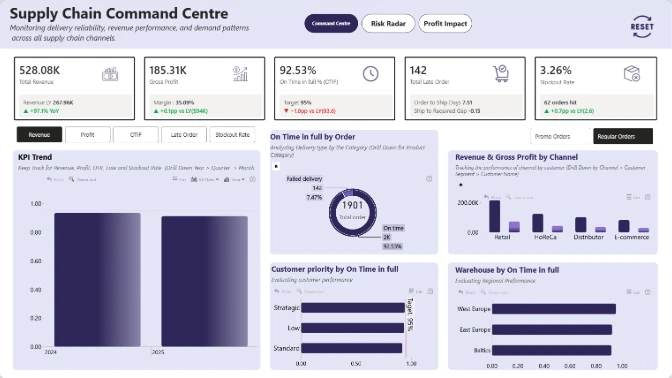
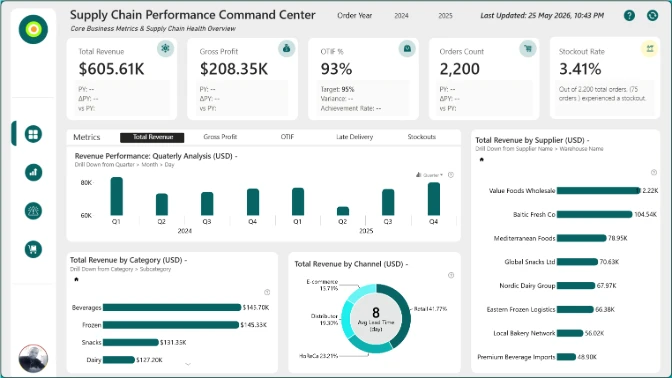
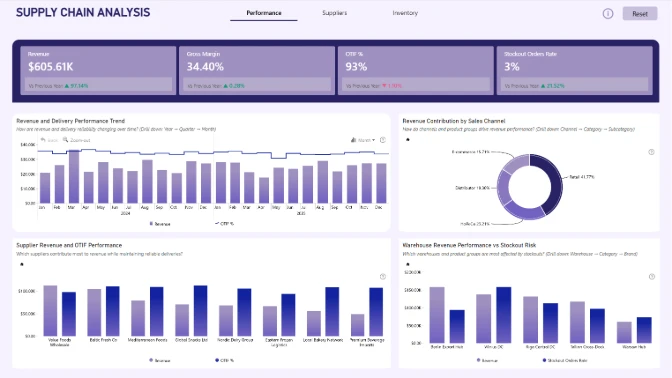
This Power BI sales dashboard is the winning entry for the FP20 Analytics December 2023 ZoomCharts Challenge. The contestant visualized retail sales of Christmas gifts with the aim to spot trends in customer behavior, identify customer segments, and analyze sales data to find potential promotional opportunities or pricing adjustments.
ZoomCharts team noted the thoughtful use of navigation elements, including slicers and cross-filtering visuals, which makes finding answers easy and intuitive. Users can easily drill down, which is aided by the titles for each visual that explain all the levels that the user can explore. Each page is focused on a specific topic, featuring visuals that dynamically cross-filter to analyze data from multiple dimensions.
This Power BI sales dashboard example is based on the challenge submission with minor refinements by the ZoomCharts team. See the original submission here.
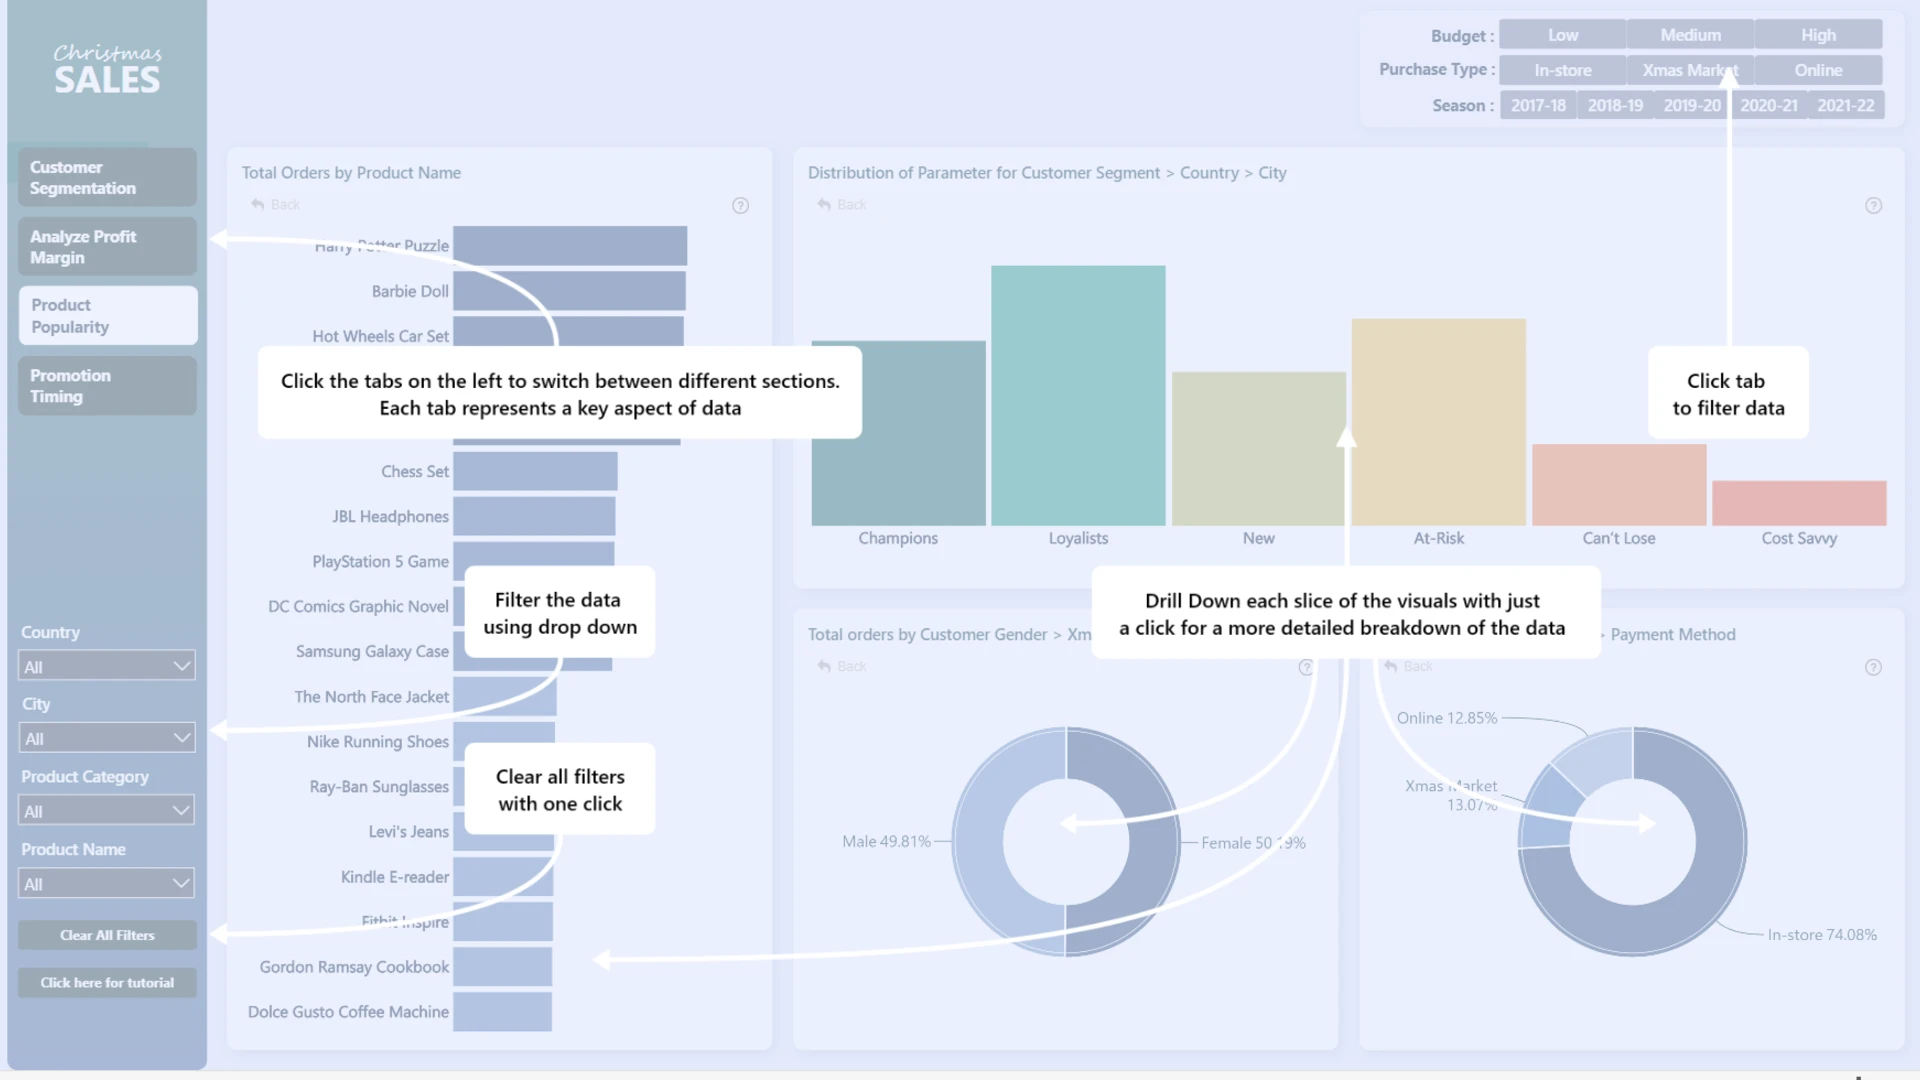
How To Use This Report Template
To interact with this Power BI report, simply click any active elements directly on the charts. Download this report to see all the settings, formulas, and calculations. Try it out with your own data by making a few adjustments.
ZoomCharts visuals used
4U Report Challenges
Participate in data challenges, build and submit reports to get free template downloads.
Join CommunityMobile view allows you to interact with the report. To Download the template please switch to desktop view.
Was this helpful? Thank you for your feedback!
Sorry about that.
How can we improve it?